Ethereum (ETH/USD) Price Ranges Between $3,000 and $2,500 Levels
Estimated Reading Time: 3 minutes
Don’t invest unless you’re prepared to lose all the money you invest. This is a high-risk investment and you are unlikely to be protected if something goes wrong. Take 2 minutes to learn more
Ethereum Price Prediction – June 7
Over a couple of trading sessions, the market valuation that exists between Ethereum and the US Dollar ranges between $3,000 and $2,000 levels. The crypto market is seen trading around the point of $2,776 at about a percentage increase of 2.40.
ETH/USD Market
Key Levels:
Resistance levels: $3,000, $3,500, $4,000
Support levels: $2,500, $2,000, $1,500
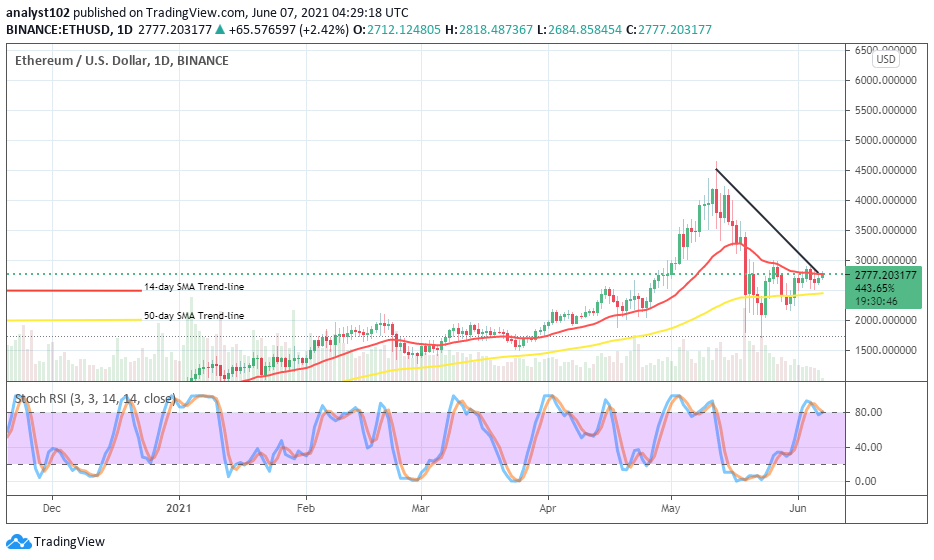
ETH/USD – Daily Char
it has been closely observed that the ETH/USD market has entered definite range-bound zones of $3,000 and $2,500. The 14-day SMA trend-line is located almost mid-point of those values earlier mentioned above the 50-day SMA indicator that is tightly below the immediate support level. The bearish trend-line drew downward to touch the smaller SMA at the trading point of the market in the range-bound levels. The Stochastic Oscillators have crossed a bit southbound in the overbought region. But, they are now with closed lines around range 80 seemingly attempting to point to the north at a later trading activity.
ETH/USD price ranges, how long will it feature?
Now that the levels of $3,000 and $2,500 have taken to be the current range-bound trading zones of Ethereum versus the US Dollar, the longer the price action remains being pushed with less active around or between those values the longer the range-bound trading situation will be experienced in the crypto economy. Therefore, the only option left to trade abiding that trading technical condition would mostly be those buy entries are located around the lower range line.
In a continuation of that trading approach, the downside entries for bears will have to be around the upper range line. However, as it is being strongly expected that most of the downward moves showing up in the market could be in the order to allow the crypto to regain strong support or supports as the case may be able to eventually make a decent rebounding effort. By that assumption, a breakout of the upper range zone appears to be in the womb of a trading day’s session. Therefore, sell order at that level needed to be much warier about..
ETH/BTC Price Analysis
Most variant trading candlesticks appear on the buy signal side of the SMAs as depicted by the ETH/BTC price analysis chart currently. The smaller SMA trend-line is been aligning around the trending weight of the base crypto pairing with the chief counter crypto. The 50-day SMA indicator is underneath the bullish trend-line that is playing a supportive role to the 14-day SMA trend-line as they are all point toward the north. The Stochastic Oscillators are in the overbought region pointing toward the northbound to indicate that some upward pressures are still featuring in favor of ETH as placed against BTC.
Note: new.cryptosignals.org is not a financial advisor. Do your research before investing your funds in any financial asset or presented product or event. We are not responsible for your investing results.