Ethereum Is in an Uptrend but Is Unable to Breach the $1,280 High
Estimated Reading Time: 2 minutes
Don’t invest unless you’re prepared to lose all the money you invest. This is a high-risk investment and you are unlikely to be protected if something goes wrong. Take 2 minutes to learn more

Free Crypto Signals Channel
Ethereum Price Long-Term Analysis: Bearish
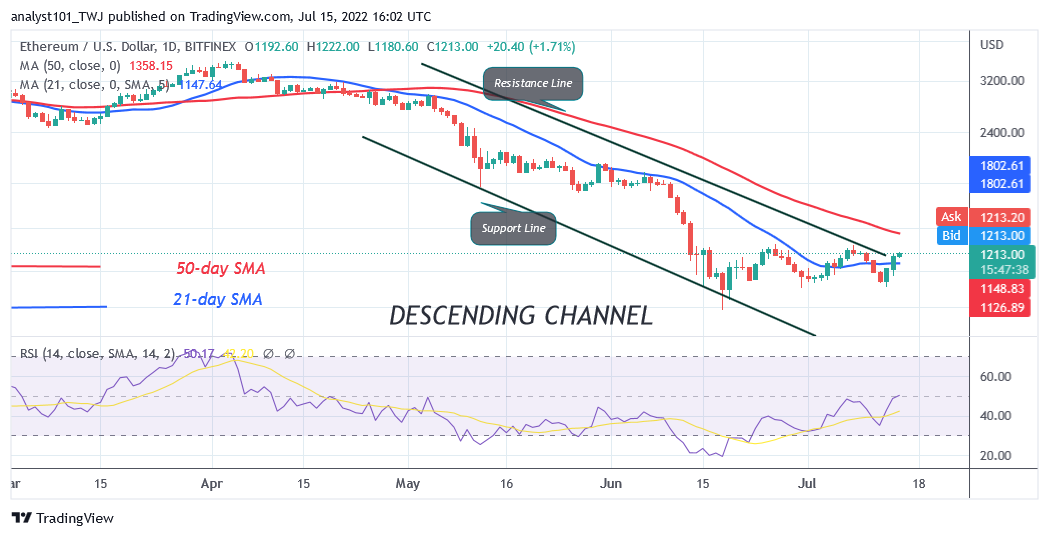
Ethereum’s (ETH) price is making an upward correction but is unable to breach the $1,280 high. The largest altcoin has risen to the high of $1,287 but was repelled. In the previous price actions, Ether was repelled as it fell above the $1,045 support. On the downside, Ether is likely to decline as bears attempt to sink the altcoin below the moving average lines. The moving average lines will now poise as resistance levels. Conversely, a break above the resistance at $1,280 will propel the altcoin to rally above the 50-day line SMA. The bullish momentum will also extend to the high of $2,013. Presently, ETH/USD is trading at $1,221.00 at the time of writing.
Ethereum Indicator Analysis
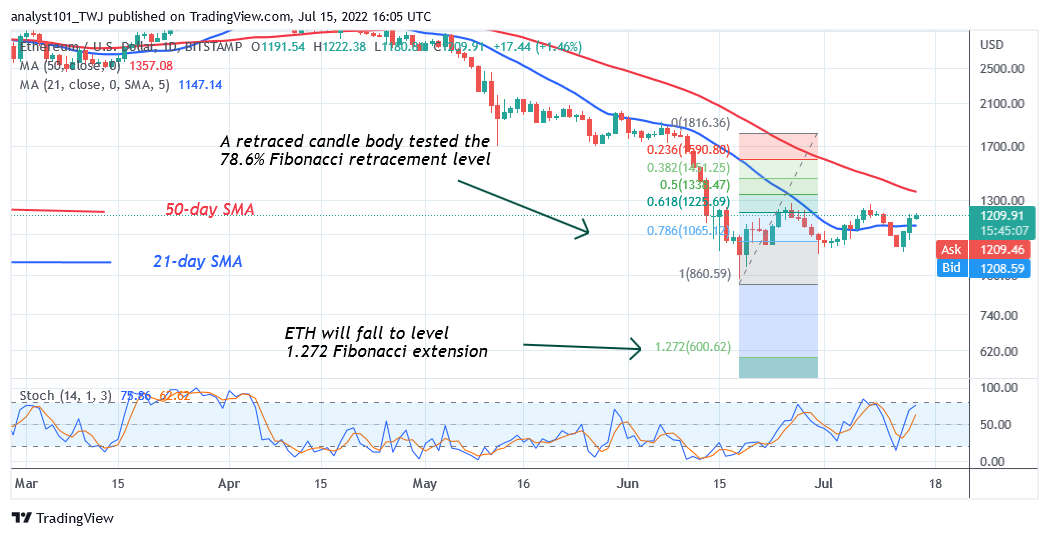
Ether is at level 50 of the Relative Strength Index for period 14. It indicates that there is a balance between supply and demand. The crypto’s price bar is above the 21-day line SMA but below the 50-day line SMA indicating a possible range-bound move. Ether will trend when the range-bound levels are breached. It is above the 75% range of the daily stochastic. The crypto is in a bullish momentum but Ether will face rejection at the $1,280 high.
Technical indicators:
Major Resistance Levels – $2, 600, $2,800, $3,000
Major Support Levels – $1.500, $1, 300, $1,100
What Is the Next Direction for Ethereum?
Ether has reached the overbought region of the market but is unable to breach the $1,280 high. The crypto is likely to decline if price breaks below the moving average lines. Meanwhile, on May 12 downtrend; a retraced candle body tested the 78.6% Fibonacci retracement level. The retracement suggests that Ether will fall but reverse at level 1.272 Fibonacci Extension or level $600.62.
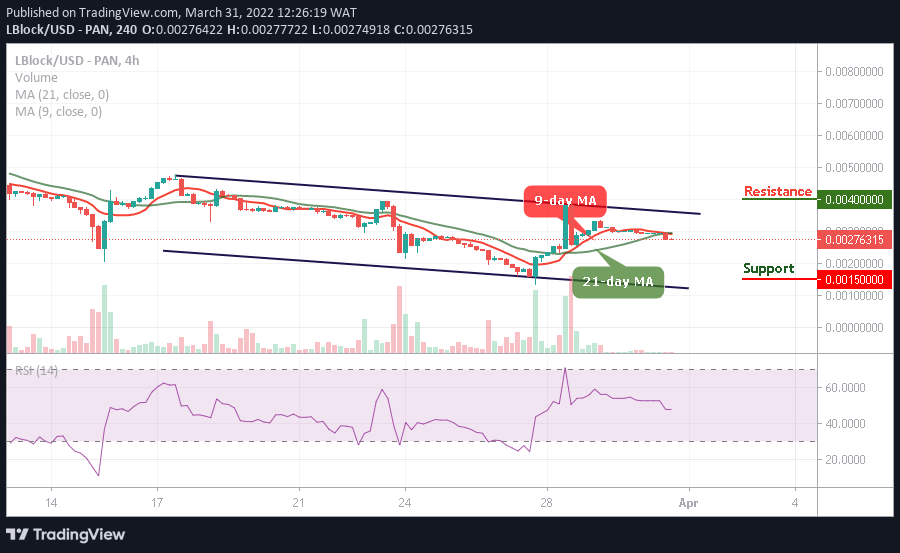
You can crypto coins here. Buy LBlock
Note: Cryptosignals.org is not a financial advisor. Do your research before investing your funds in any financial asset or presented product or event. We are not responsible for your investing results