Ethereum Is on Track to Break the $1,678 Barrier
Don’t invest unless you’re prepared to lose all the money you invest. This is a high-risk investment and you are unlikely to be protected if something goes wrong. Take 2 minutes to learn more

Ethereum Price Long-Term Analysis: Bullish
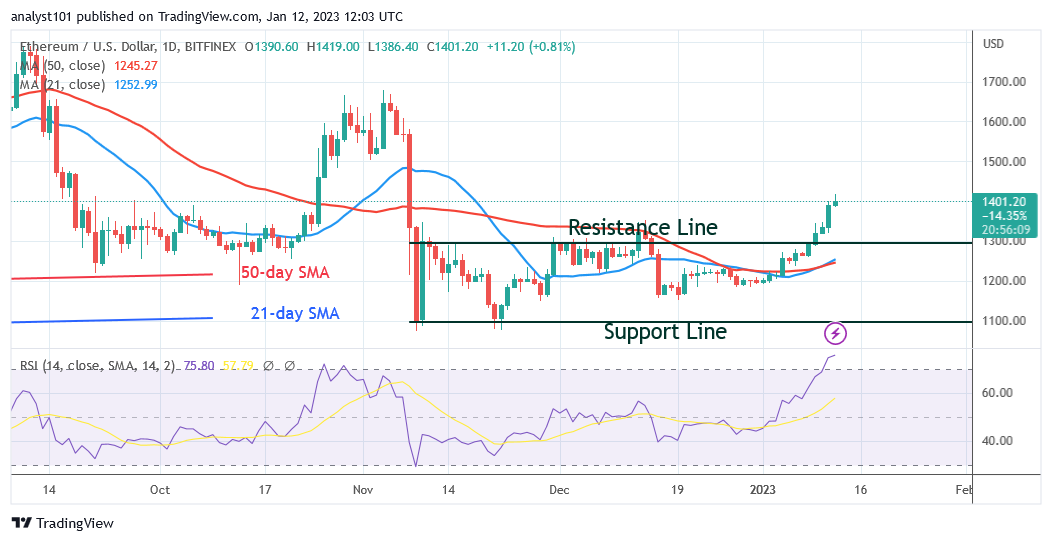
Ethereum (ETH) price crosses the $1,300 resistance and is on track to break the $1,678 barrier. The largest altcoin rose to a high of $1,418 before declining. After a slight correction, the bullish momentum might carry on. Even if Ether is overbought, the altcoin can still reach its previous high of $1,678 if the positive trend continues. However, in a market that is actively trending, the asset’s overbought condition may not endure. On the plus side, the largest altcoin is probably going to hit the $1,678 price level from November 4. If the bullish momentum is not maintained, Ether will fall and find support above the breakout level of $1,352.70. As of this writing, the asset is now worth up to $1,402 in total.
Ethereum Indicator Analysis
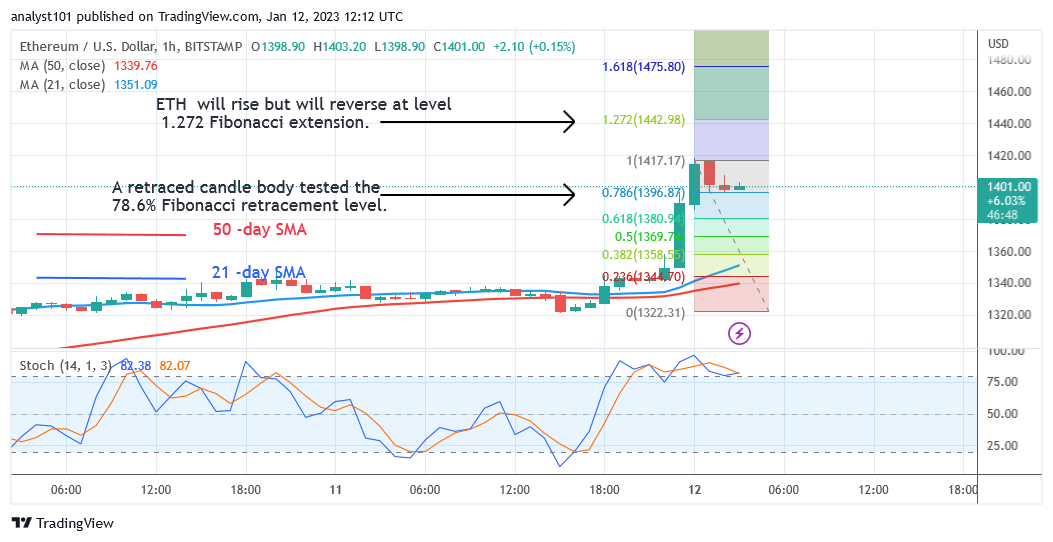
At level 75 of the Relative Strength Index for period 14, Ether has crossed over into the overbought zone. As the market approaches the overbought zone, the current positive momentum could slow down. Ether is also above level 80 of the daily Stochastic. Since January 11, the largest altcoin has been trading in the overbought zone. The moving average lines are above the price bars, which is what is causing the cryptocurrency’s current price increase.

Technical indicators:
Major Resistance Levels – $2, 600, $2,800, $3,000
MajorSupport Levels – $1.500, $1, 300, $1,100
What Is the Next Direction for Ethereum?
Ether is on the rise and is on track to break the $1,678 mark. The largest altcoin rose to a high of $1,418 but ran into initial resistance. The initial retracement may drive the altcoin to increase even more. A retraced candle body on the upward trend of January 12 tested the 78.6% Fibonacci retracement line. According to the retracement, ETH will increase but will turn around at level 1.272 Fibonacci extension, or $1,442.98.

You can buy crypto coins here. Buy LBLOCK
Note: Cryptosignals.org is not a financial advisor. Do your research before investing your funds in any financial asset or presented product or event. We are not responsible for your investing results


