Ethereum Resumes Uptrend, Battles the Resistance at Level $4,800
Estimated Reading Time: 2 minutes
Don’t invest unless you’re prepared to lose all the money you invest. This is a high-risk investment and you are unlikely to be protected if something goes wrong. Take 2 minutes to learn more

Ethereum Price Long-Term Analysis: Bullish
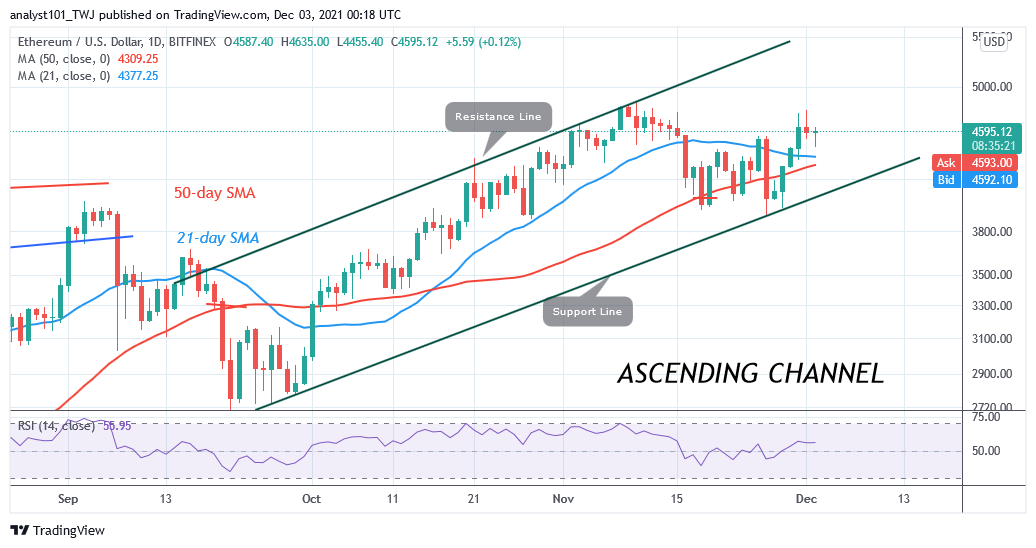
Ethereum (ETH) price has broken above the 21-day line moving average and the 50-day line moving averages. The biggest altcoin has risen to the high of $4,755.90. The upward move is facing rejection at the $4,800 resistance zone. The altcoin will rally to $5,000 if the current resistance is breached.
Ethereum Indicator Analysis
The crypto’s price is above the 21-day line moving average and the 50-day line moving average which indicates a possible upward move of the coin. Ether has risen to level 55 of the Relative Strength Index for period 14. Ether is in the uptrend zone and capable of a further upward move. The cryptocurrency is above 50% area of the daily stochastic. The altcoin is in a bullish momentum.
Technical indicators:
Major Resistance Levels – $2, 600, $2,800, $3,000
Major Support Levels – $1.500, $1, 300, $1,100
What Is the Next Direction for Ethereum?
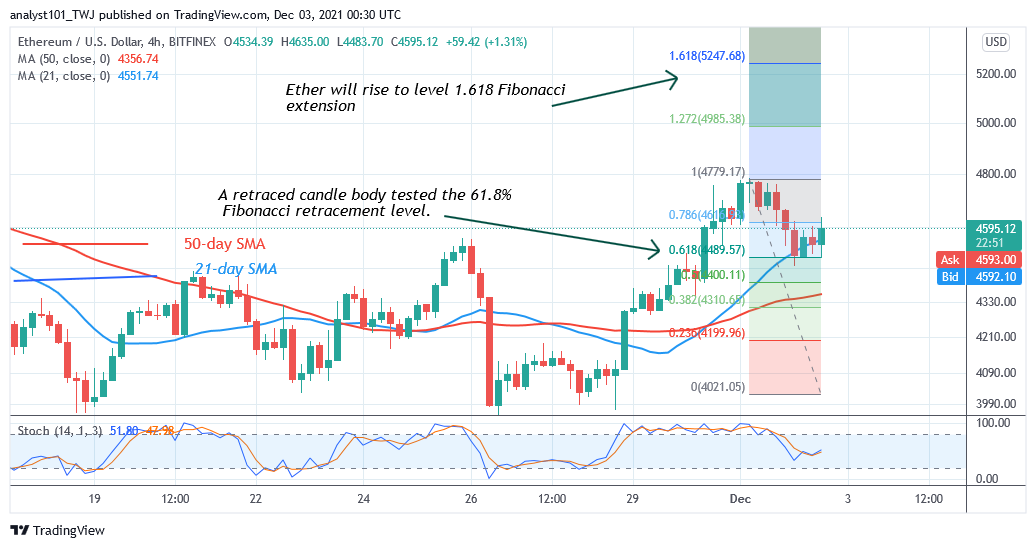
The biggest altcoin has resumed its upward move. The first uptrend was stalled at the $4,800 resistance level. If the current resistance is breached, a rally above $5,000 is possible. Meanwhile, on December 1 uptrend; a retraced candle body tested the 61.8% Fibonacci retracement level. The retracement indicates that Ethereum will rise to level 1.618 Fibonacci extension or $5,247.68 . From the price action, the market is facing rejection at $4,600.
You can crypto coins here. Buy Tokens
Note: Cryptosignals.org is not a financial advisor. Do your research before investing your funds in any financial asset or presented product or event. We are not responsible for your investing results