Lucky Block (LBLOCK): Chart Insights Signal a Potential Bullish Breakout
Estimated Reading Time: 3 minutes
Don’t invest unless you’re prepared to lose all the money you invest. This is a high-risk investment and you are unlikely to be protected if something goes wrong. Take 2 minutes to learn more

Lucky Block (LBLOCK) continues to capture the interest of investors as its price action shows potential for a bullish breakout. With its innovative approach to blockchain gaming and ongoing community support, LBLOCK remains a token worth watching. Let’s dive into the latest daily and 4-hour chart analysis to uncover the opportunities that may lie ahead.
LBLOCK’s Promising Signs on the Daily Chart
The daily chart for LBLOCK suggests that the token may be setting the stage for a rally. Currently trading around $0.00001499, the price is consolidating near the lower Bollinger Band, indicating oversold conditions. Historically, such positioning has often been followed by upward momentum. The RSI value of 42.46 is approaching the neutral zone, with a bullish divergence forming over the last few weeks. This divergence signals that selling pressure is waning, and buyers may soon take control.
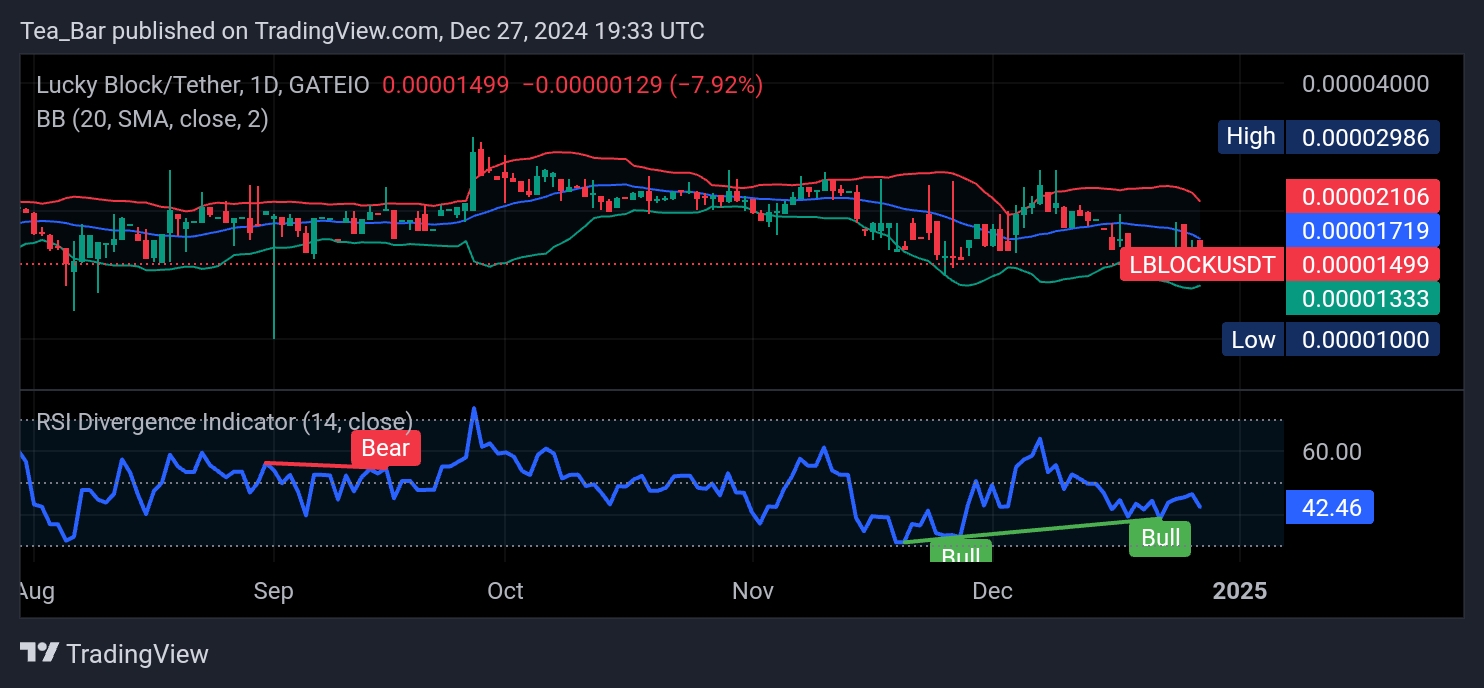
Moreover, LBLOCK has maintained support at $0.00001333, a level that has repeatedly acted as a springboard for upward moves. Resistance at $0.00001719 appears to be the next target, and a breakthrough could open the door to $0.00002106. The token’s gradual recovery in volume also points to growing confidence among traders.
What the 4-Hour Chart Reveals About LBLOCK’s Momentum
On the 4-hour chart, LBLOCK showcases similar bullish undertones. The price is hovering just below the midline of the Bollinger Bands, with the RSI at 45.59, suggesting that the token is gathering momentum. A notable bullish divergence is also present, which further supports the possibility of a rebound.
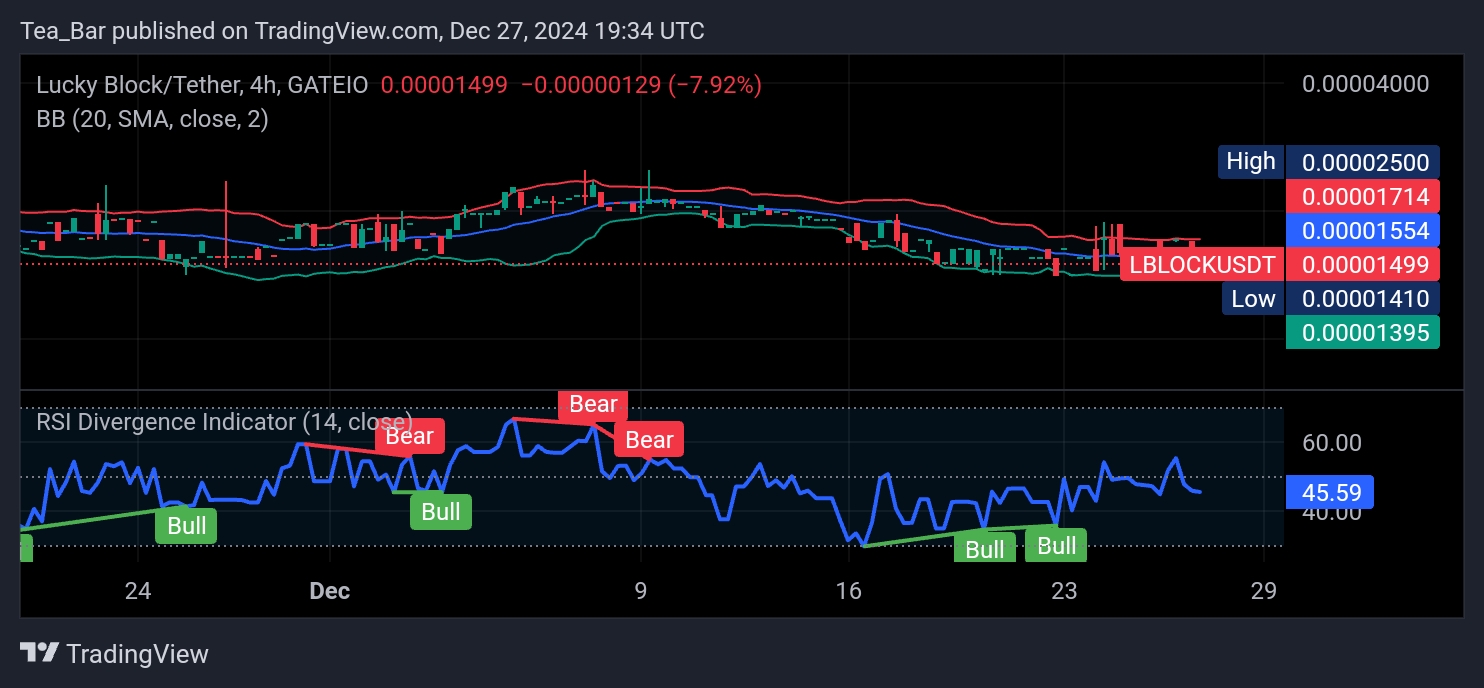
Support at $0.00001395 has remained intact, providing a reliable floor for short-term traders. Resistance at $0.00001554 is within reach, and breaking above it could signal a shift in momentum toward higher targets. The tightening of the Bollinger Bands indicates that a volatility spike is imminent, likely favoring upward movement.
Conclusion
Lucky Block’s technical indicators hint at an impending bullish breakout, driven by strengthening support and positive divergences on both daily and 4-hour charts. As LBLOCK continues to recover from its recent lows, it positions itself as a promising opportunity for investors seeking high-potential tokens. While caution is always advised, LBLOCK’s charts suggest that now might be an opportune moment to watch this token closely.
You can purchase Lucky Block here. Buy LBLOCK.