Lucky Block (LBLOCK): Eyeing a Breakout Amidst Positive Signals
Estimated Reading Time: 3 minutes
Don’t invest unless you’re prepared to lose all the money you invest. This is a high-risk investment and you are unlikely to be protected if something goes wrong. Take 2 minutes to learn more

Lucky Block (LBLOCK) is showing signs of building momentum despite recent fluctuations. Currently priced at $0.00001965, LBLOCK has dipped 2.67% over the last 24 hours, but technical indicators suggest that a bullish resurgence could be on the horizon.
LBLOCK/USDT Daily Chart: Consolidation with Potential
The daily chart paints an intriguing picture, with Bollinger Bands narrowing to a range between $0.00002246 (upper band) and $0.00001431 (lower band). LBLOCK’s price hovers near the middle band at $0.00001839, signaling a phase of consolidation. This tightening range often precedes significant price action, and a breakout above $0.00002200 could lead to a medium-term target of $0.00003400.
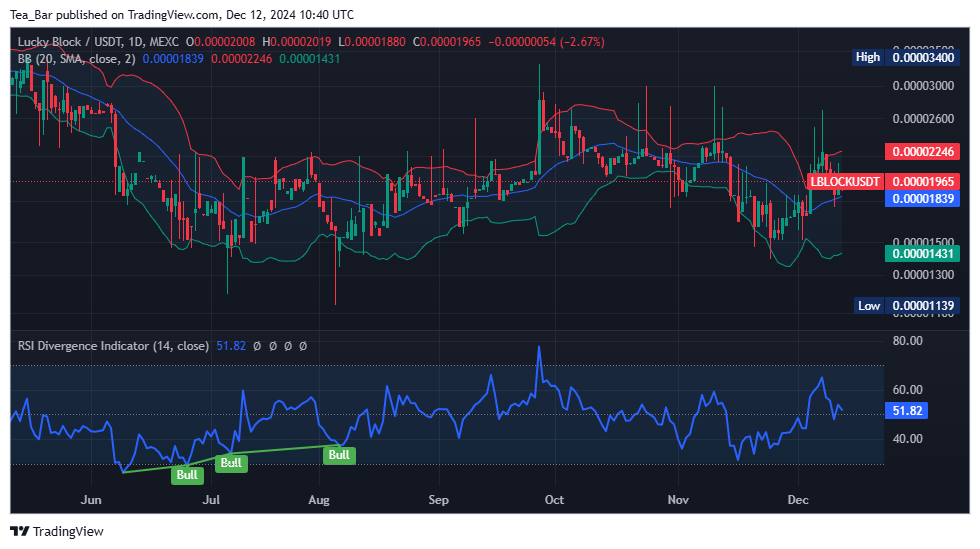
The RSI sits at 51.82, reflecting neutral-to-bullish sentiment. Positive divergences observed in previous months hint at steady accumulation and growing confidence among investors. These elements create a favorable backdrop for potential upward movement.
LBLOCK/USDT 4-Hour Chart: Eyeing Resistance Levels
Zooming into the 4-hour chart, LBLOCK remains stable at $0.00001965, trading near the Bollinger Bands’ midline. The upper band rests at $0.00002188, while the lower band supports at $0.00001838, illustrating a relatively narrow range. Immediate support at $0.00001880 has proven resilient, and a breakout above $0.00002013 could set the stage for a climb toward $0.00002300.
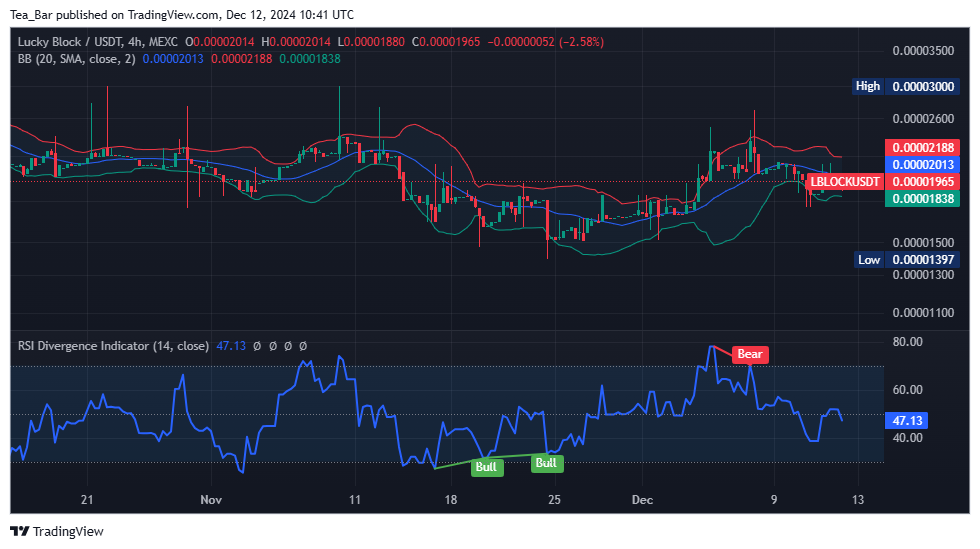
The RSI, currently at 47.13, suggests neutrality with a potential for recovery. Historical bullish divergences in this timeframe further enhance the likelihood of a rebound, as LBLOCK has demonstrated resilience following oversold conditions.
Bright Prospects for Lucky Block
Lucky Block’s innovative ecosystem and active community engagement continue to bolster its long-term appeal. The strong support level at $0.00001830 provides stability, while $0.00002200 remains the key resistance to watch. Breaking past this threshold could ignite a rally, attracting heightened investors’ interest.
Conclusion
LBLOCK is poised for an exciting phase as technical indicators point toward strengthening momentum. A decisive move beyond $0.00002200 could mark the start of a bullish trend, making it an attractive option for both long-term investors and short-term traders. The token’s consolidation phase presents a compelling opportunity, with the potential for significant upside in the near future.
You can purchase Lucky Block here. Buy LBLOCK.