Lucky Block (LBLOCK) Gains Momentum – Is a Breakout on the Horizon?
Estimated Reading Time: 2 minutes
Don’t invest unless you’re prepared to lose all the money you invest. This is a high-risk investment and you are unlikely to be protected if something goes wrong. Take 2 minutes to learn more

Lucky Block: A Glimpse on the Daily Chart
Lucky Block (LBLOCK) is showing signs of potential recovery after a recent dip, currently trading at $0.00000897. Despite a short-term retracement, LBLOCK remains well-positioned for a bullish comeback. The Parabolic SAR indicator on the daily chart has started to flatten, signaling a possible shift in trend. Meanwhile, the MACD histogram is nearing a crossover, suggesting that selling pressure is easing.
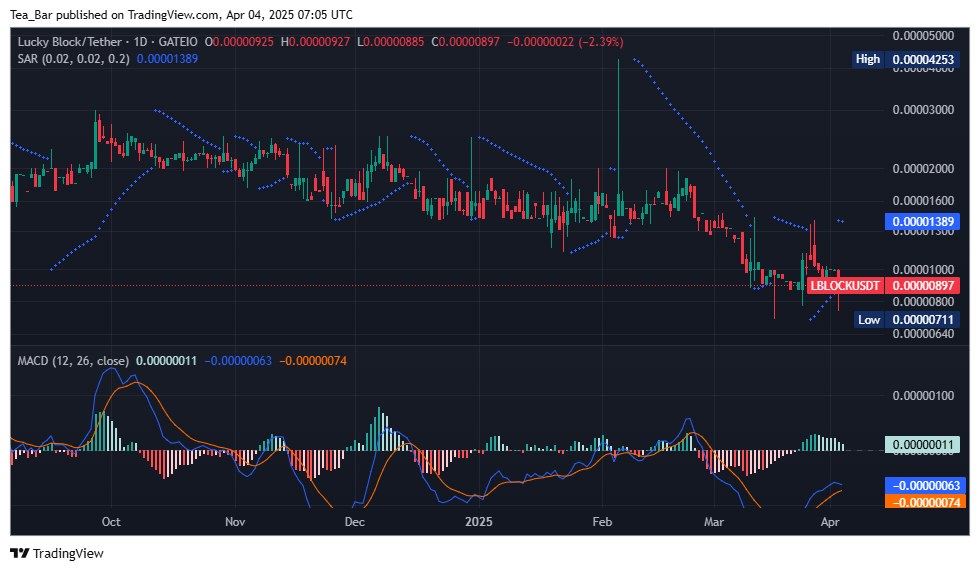
The key resistance to watch is at $0.00001389, where previous support turned into resistance. If buyers step in, LBLOCK could reclaim this level and target a higher move toward $0.00001600. On the downside, $0.00000711 serves as crucial support, providing a solid foundation for any potential bounce.
4-Hour Chart Insights
The 4-hour chart further strengthens the bullish outlook, as LBLOCK has stabilized after its recent consolidation phase. The Parabolic SAR dots are hovering close to the price action, indicating that a trend reversal could be imminent. Additionally, the MACD indicator is on the verge of flipping bullish, hinting at increasing momentum.
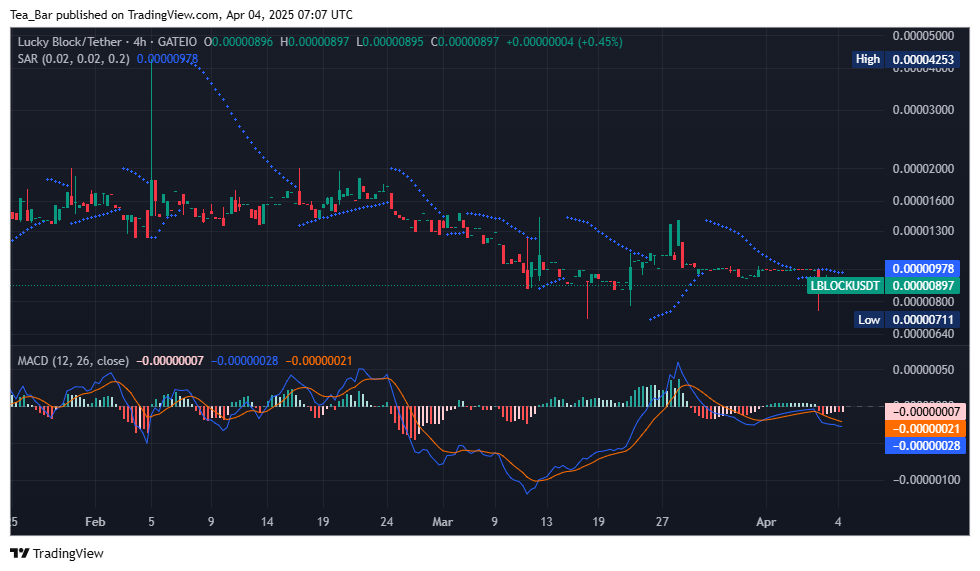
For LBLOCK to break out, it needs to push past $0.00000978, which has acted as a resistance level. A decisive move above this could open the doors for a rally toward $0.00001200 in the near term.
Conclusion
Lucky Block’s recent stabilization presents an exciting opportunity for traders and investors. With technical indicators hinting at a potential turnaround, LBLOCK could be gearing up for its next breakout. If bullish momentum continues, Lucky Block could reclaim key resistance levels and position itself for a stronger rally. Keep an eye on price action, as a breakout may be just around the corner!
Invest wisely, and let Lucky Block’s potential work in your favor. You can purchase Lucky Block here. Buy LBLOCK.