Lucky Block (LBLOCK) Ignites Fresh Momentum with Promising Technical Recovery
Estimated Reading Time: 3 minutes
Don’t invest unless you’re prepared to lose all the money you invest. This is a high-risk investment and you are unlikely to be protected if something goes wrong. Take 2 minutes to learn more

Lucky Block (LBLOCK) is beginning the week on a high note as bullish energy returns to the market. Trading around $0.00001901, the token is showing strong recovery potential after weeks of consolidation. With a clear technical rebound underway and community sentiment steadily improving, Lucky Block continues to stand out as one of the most exciting tokens in the crypto market. The project’s consistent innovation and active investor support have positioned it well for the next upward leg, making it a coin to watch as November approaches.
LBLOCK Daily Chart Analysis: Signs of Renewed Strength Emerging
On the daily chart, Lucky Block is regaining traction after forming a sturdy base near $0.00001519. The recent bounce has lifted prices above $0.00001900, with the Parabolic SAR beginning to flatten—an early sign that bearish control may be fading. The MACD indicator supports this shift, as the histogram is turning positive, hinting at rising momentum and potential for a bullish crossover. This renewed technical alignment suggests buyers are regaining confidence and preparing for a broader recovery phase.
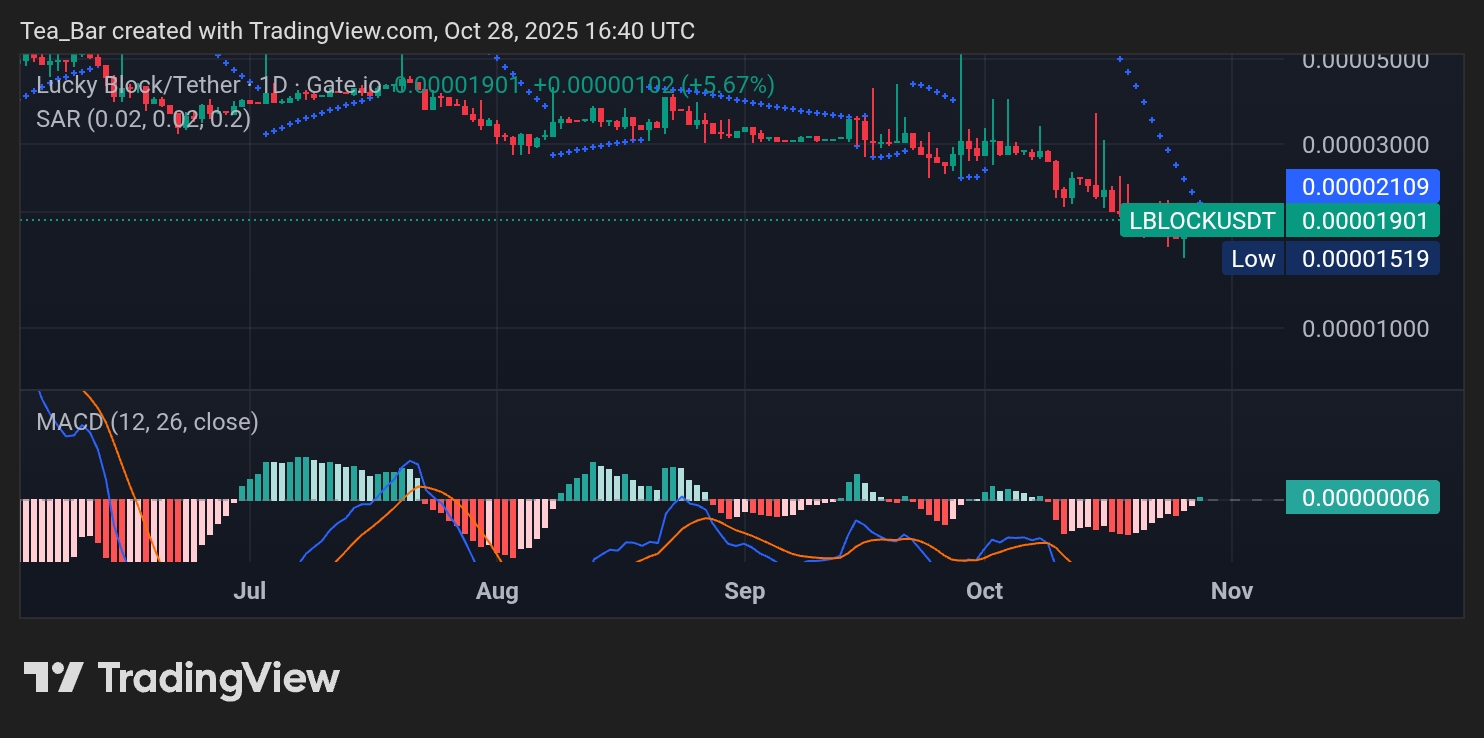
If momentum persists, LBLOCK could target $0.00002109 as its immediate resistance, followed by $0.00002700 and $0.00003900 as higher objectives. A daily close above these zones could trigger a more decisive upward breakout, opening the door for an extended rally supported by growing market enthusiasm and sustained community engagement.
LBLOCK 4-Hour Chart Analysis: Momentum Builds for a Potential Upswing
On the 4-hour chart, Lucky Block continues to show encouraging signs of accumulation. The token has maintained a steady climb above $0.00001680, with the Parabolic SAR dots gradually shifting below the candles—a bullish signal that could precede stronger upward action. Meanwhile, the MACD lines are moving toward a crossover, indicating that positive sentiment is gaining traction across shorter timeframes.
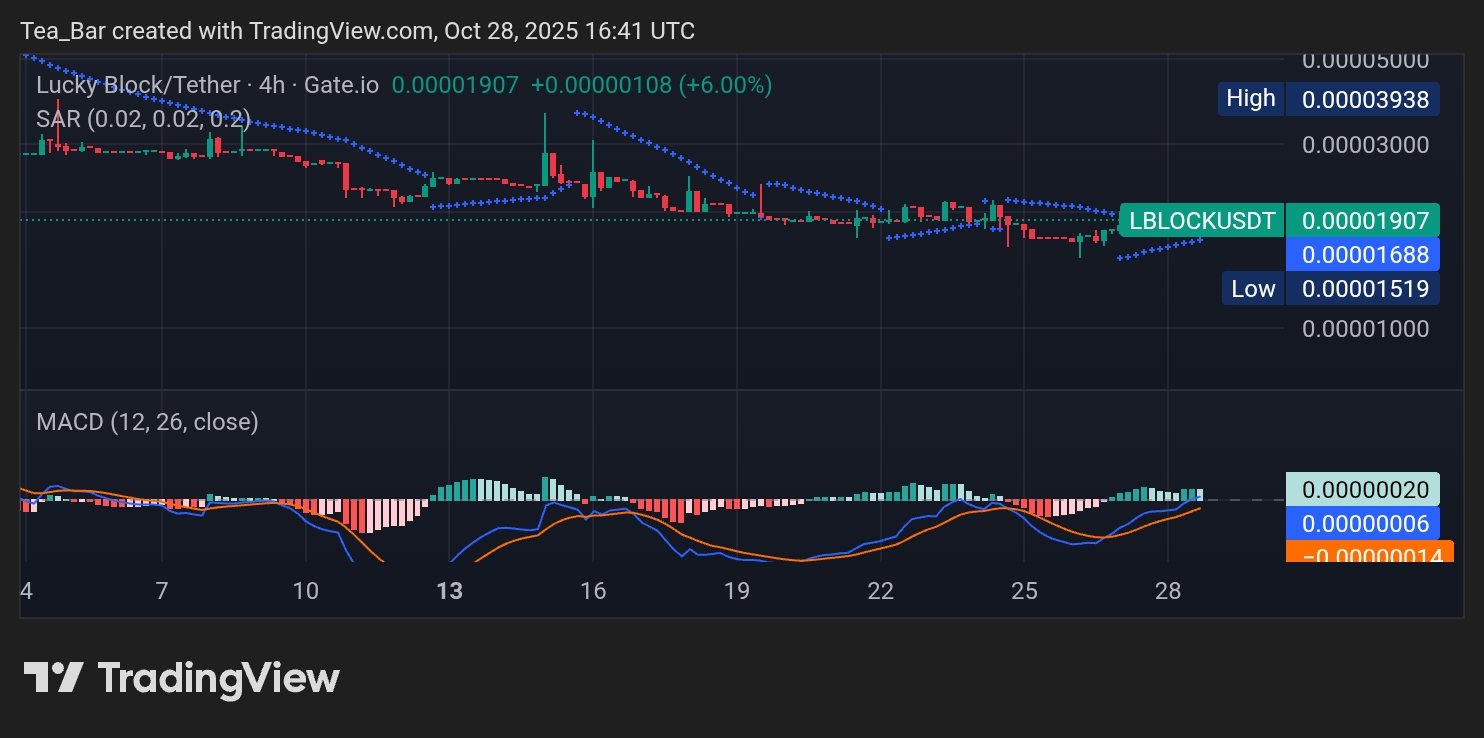
If this structure holds, a break above $0.00002000 could invite further buying, pushing LBLOCK toward $0.00002768 in the near term. The tightening price action suggests that volatility is likely to expand soon, favoring a bullish continuation if current momentum persists.
Conclusion: Lucky Block Reaffirms Its Position as a Token to Watch
Lucky Block’s latest recovery phase highlights its resilience and growing investor confidence. The combination of rising technical strength and solid community backing makes LBLOCK a compelling option for traders seeking exposure to promising micro-cap assets. As bullish signals strengthen, Lucky Block could soon embark on a broader rally, reaffirming its place among the most dynamic and opportunity-rich projects in today’s crypto landscape.
Invest wisely, and let Lucky Block’s potential work in your favor. You can purchase Lucky Block here. Buy LBLOCK.