Lucky Block (LBLOCK): Orchestrating a Bullish Symphony Across Timeframes
Estimated Reading Time: 3 minutes
Don’t invest unless you’re prepared to lose all the money you invest. This is a high-risk investment and you are unlikely to be protected if something goes wrong. Take 2 minutes to learn more

Lucky Block (LBLOCK) is striking a bullish chord, blending technical resilience with upward momentum. As traders analyze its chart patterns, a compelling narrative of potential breakout unfolds. Let’s explore the rhythm behind LBLOCK’s anticipated surge.
Daily Chart Analysis: A Bullish Waltz in Motion
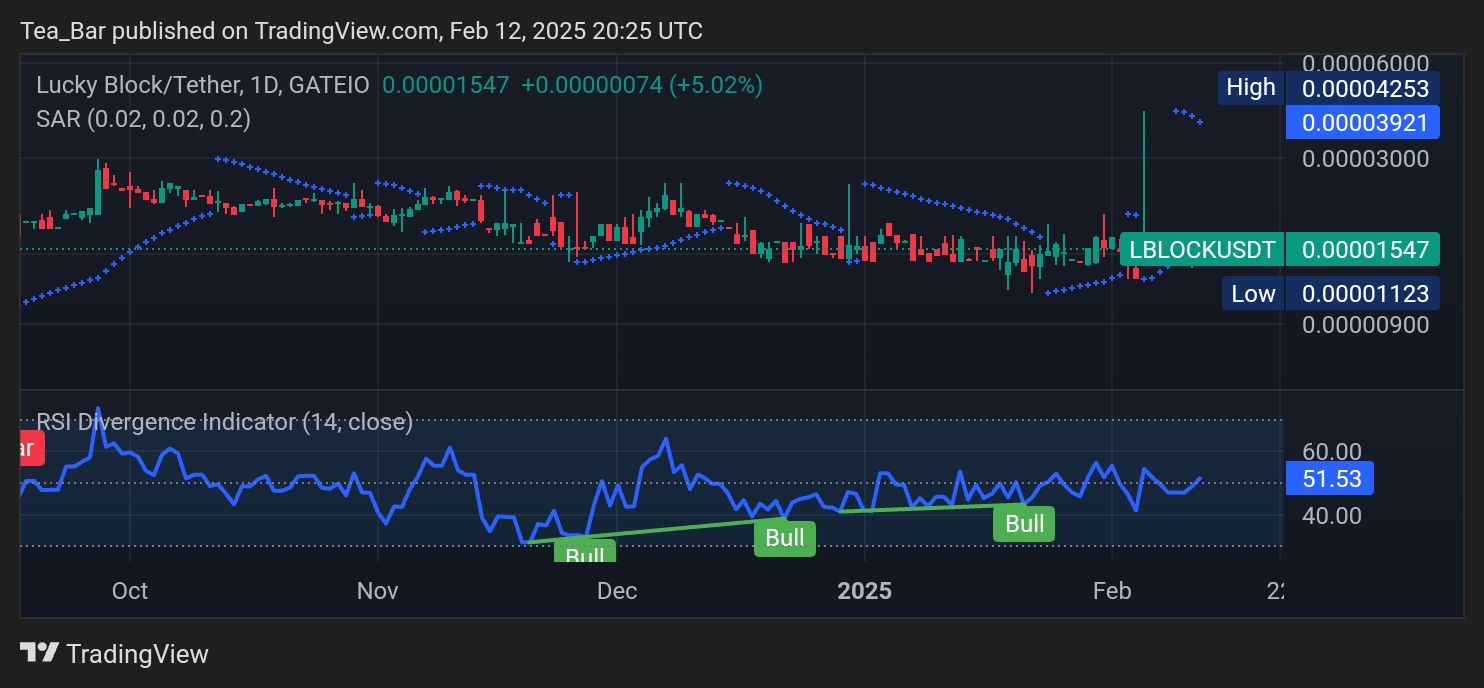
The daily chart paints a picture of disciplined upward movement. The Parabolic SAR (0.02, 0.02, 0.2)—a key trend indicator—has positioned dots below the price since late 2024, reinforcing the ongoing uptrend. The 2025 support at 0.00000900 acts as a strong foundation, where buyers consistently step in to defend declines.
Meanwhile, the RSI Divergence Indicator (14-period) sits at 51.53, maintaining a neutral stance—neither overbought nor oversold. Previous bullish rallies in late 2024 suggest LBLOCK’s capacity for sustained upward momentum. With the price consolidating near 0.00001547, the stage is set for a potential push toward 0.00003000, a key resistance level from past upswings.
4H Chart Analysis: A Surge of Energy and Momentum
On the 4-hour chart, bullish momentum is surging. A 5.02% rally to 0.00001547 was accompanied by an increase in volume, reinforcing the strength of the move. The Parabolic SAR continues to signal an uptrend, with its dots trailing below the price.
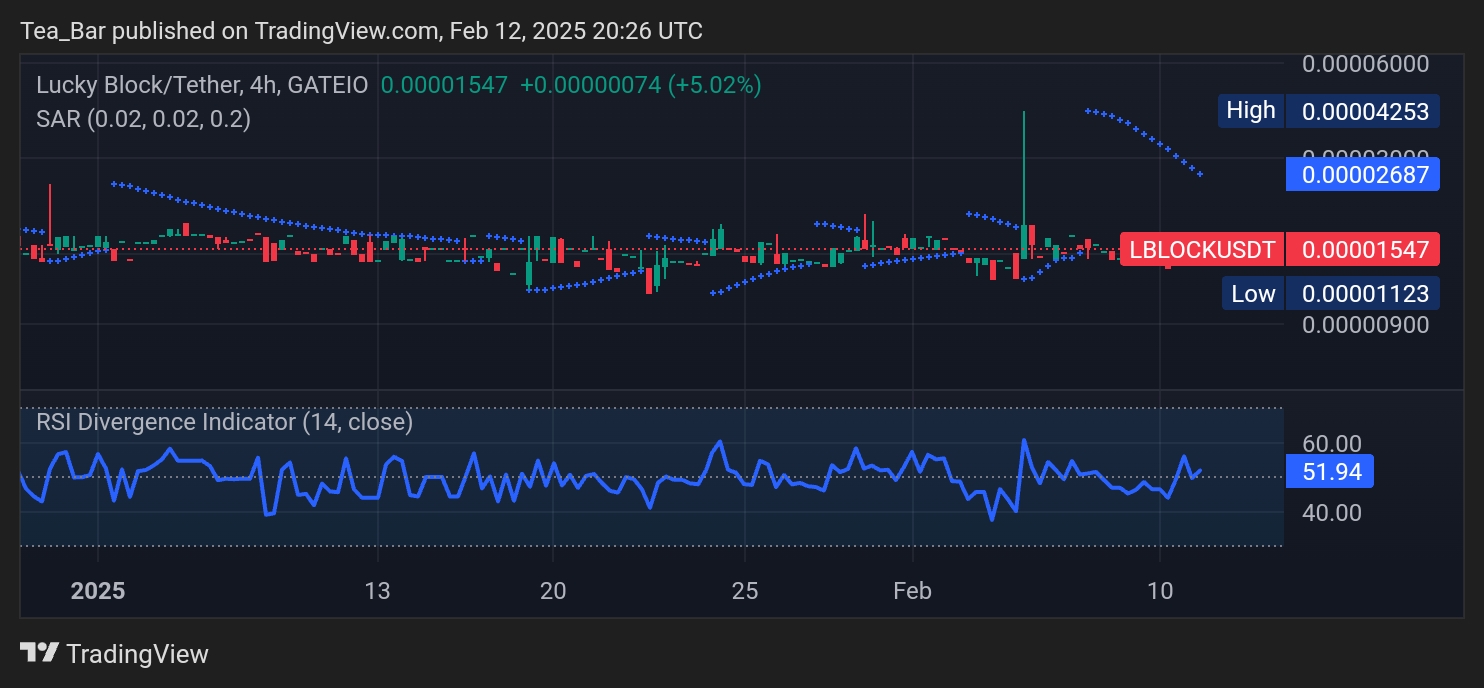
The RSI (14), currently at 60.00, indicates growing buying pressure while leaving room for further gains. Strong support at 0.00001123 remains a critical foundation, and a decisive breakout above 0.00002607 could trigger a sharp move toward 0.00004253, a significant resistance last tested in 2024.
Looking Ahead: LBLOCK’s Potential for a Standout 2025
Lucky Block’s bullish trajectory appears to be gaining momentum. The alignment of the Parabolic SAR across timeframes and the RSI’s steady positioning suggests the potential for a breakout. A move past 0.00004253 could set the stage for a rally toward 0.00006000, bringing it closer to previous highs.
With market sentiment leaning bullish, LBLOCK’s resilience in bouncing from support levels highlights its strength. Watching for surges in volume and RSI increases could provide further confirmation. As the crypto market searches for standout performers, LBLOCK’s 2025 outlook remains highly promising—offering an exciting opportunity for early investors.
Invest wisely, and let Lucky Block’s potential work in your favor. You can purchase Lucky Block here. Buy LBLOCK.