Lucky Block (LBLOCK) Positions for a Bullish Comeback as Momentum Builds
Estimated Reading Time: 3 minutes
Don’t invest unless you’re prepared to lose all the money you invest. This is a high-risk investment and you are unlikely to be protected if something goes wrong. Take 2 minutes to learn more

Lucky Block (LBLOCK) is showing signs of renewed strength as the token steadies around $0.00001552, marking a slight daily decline of 1.77% but maintaining an encouraging technical foundation. After weeks of consolidation, buyers appear to be preparing for a potential reversal, supported by improving momentum indicators and market optimism surrounding altcoins. The community’s growing engagement and confidence in Lucky Block’s innovative ecosystem continue to reinforce the token’s long-term potential.
LBLOCK Daily Chart: Stabilizing Before a Push Higher
The daily chart indicates that Lucky Block is holding firm above the $0.00001401 support level, demonstrating resilience after recent declines. The Parabolic SAR dots remain above the candlesticks, showing that bearish pressure persists, but their closer alignment hints at an upcoming trend shift. At the same time, the MACD histogram has turned slightly positive, signaling that selling pressure is weakening and momentum could soon tilt in favor of the bulls.
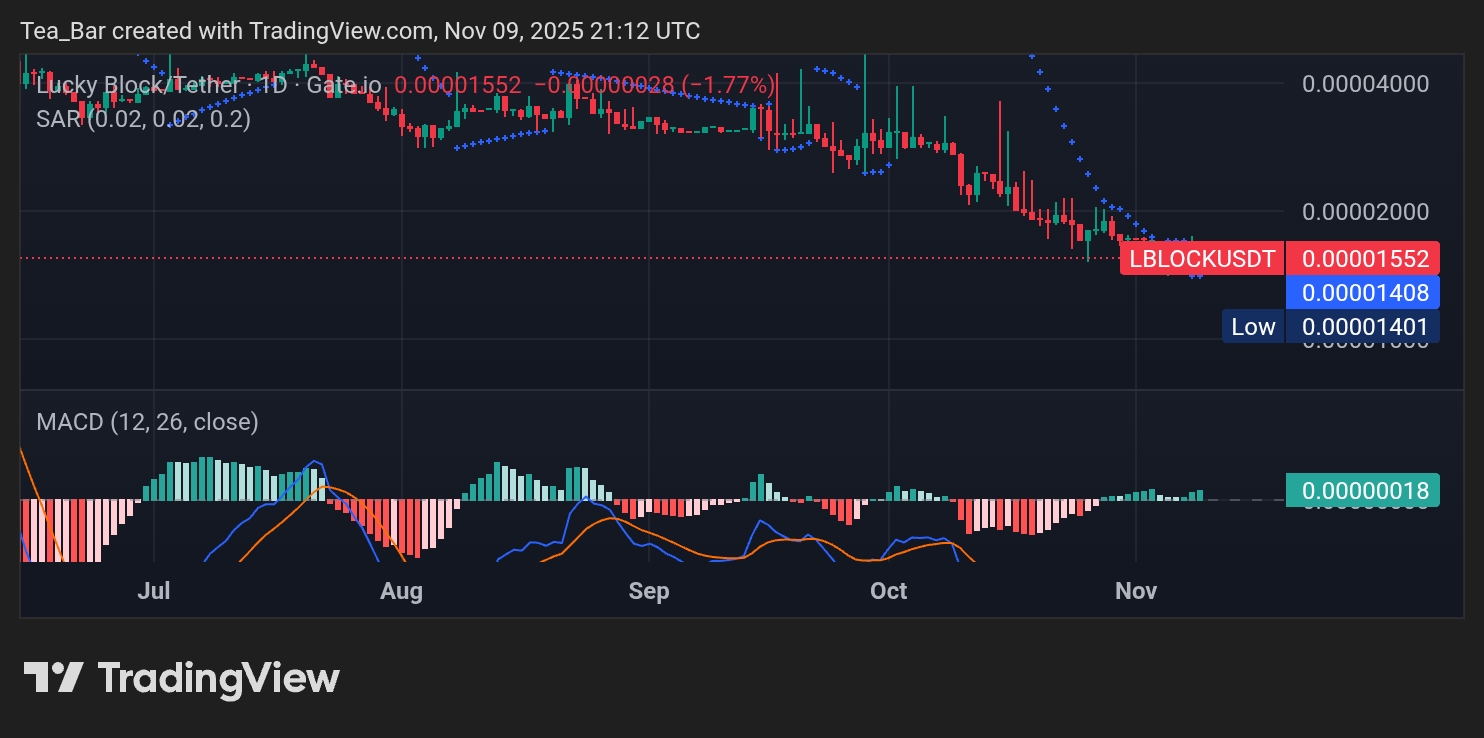
If the price sustains above $0.00001408 and gathers volume support, LBLOCK could soon test the key resistance levels at $0.00001723 and $0.00002000. A confirmed breakout above these zones would strengthen the bullish outlook and potentially set the stage for a broader recovery toward $0.00002545 in the coming sessions.
LBLOCK 4-Hour Chart: Early Signs of Recovery Emerging
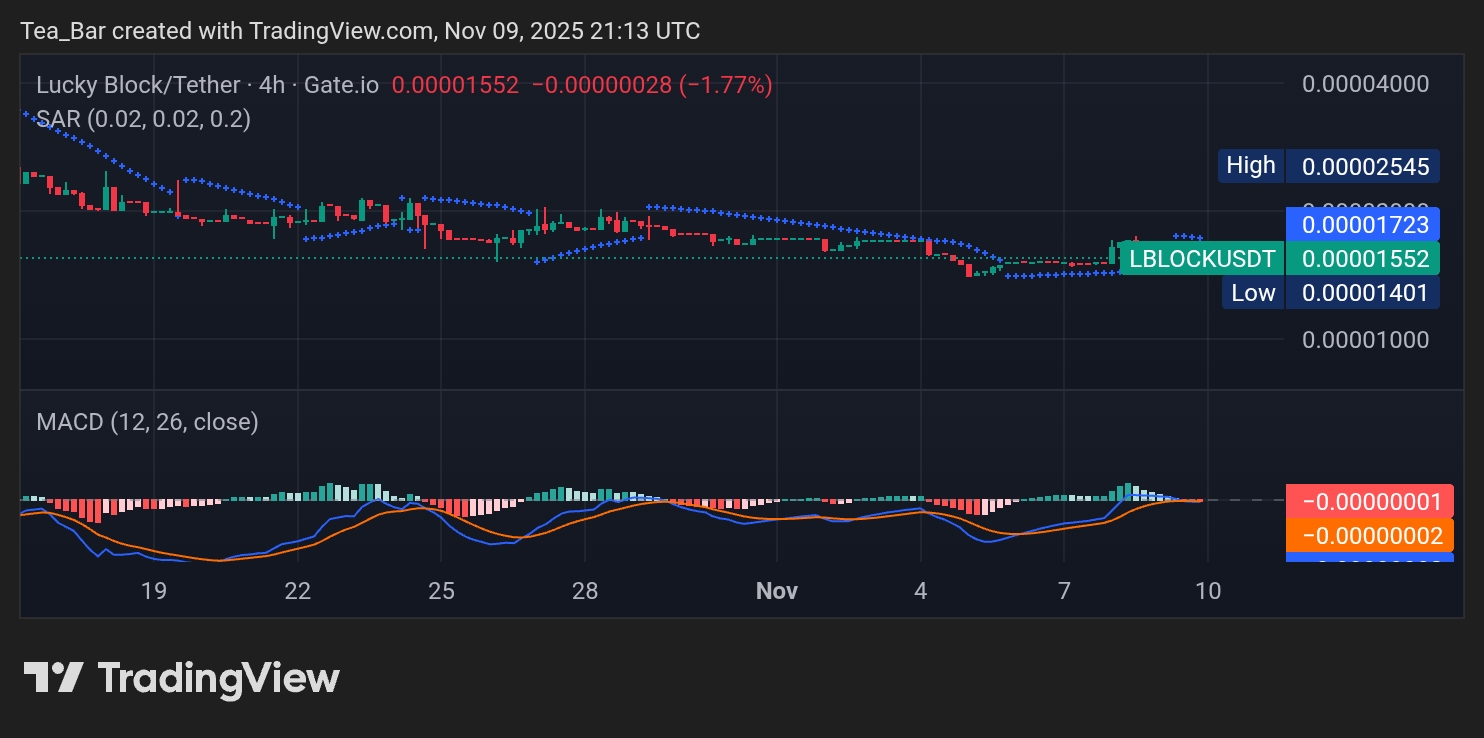
On the 4-hour chart, Lucky Block displays a compact trading range between $0.00001424 and $0.00001723, suggesting accumulation by short-term traders. The MACD lines are converging near the zero level, pointing toward an equilibrium that often precedes an upside breakout. Meanwhile, the Parabolic SAR dots are drawing closer beneath recent candles, indicating fading bearish dominance and a growing probability of a bullish reversal.
If the bulls manage to hold above $0.00001550 and push toward $0.00001723, momentum could accelerate quickly, attracting more buyers back into the market. This setup reinforces the view that Lucky Block is building a solid base for renewed upward movement.
Conclusion: Lucky Block’s Bright Prospects Ahead
Lucky Block continues to stand out as a token with strong technical potential and a vibrant community behind it. As the charts point toward possible momentum recovery, investors are watching closely for a breakout confirmation above the short-term resistance zone. With improving sentiment and firm technical signals, LBLOCK could soon reclaim its bullish momentum and reaffirm its place among the most promising low-cap tokens of 2025.
Invest wisely, and let Lucky Block’s potential work in your favor. You can purchase Lucky Block here. Buy LBLOCK.