Lucky Block Price Prediction: LBLOCK/USD Ranges; Price Ready for the Upside
Estimated Reading Time: 3 minutes
Don’t invest unless you’re prepared to lose all the money you invest. This is a high-risk investment and you are unlikely to be protected if something goes wrong. Take 2 minutes to learn more
Lucky Block Price Prediction – November 13
The Lucky Block price prediction shows that LBLOCK is moving sideways before heading toward the upper boundary of the channel.
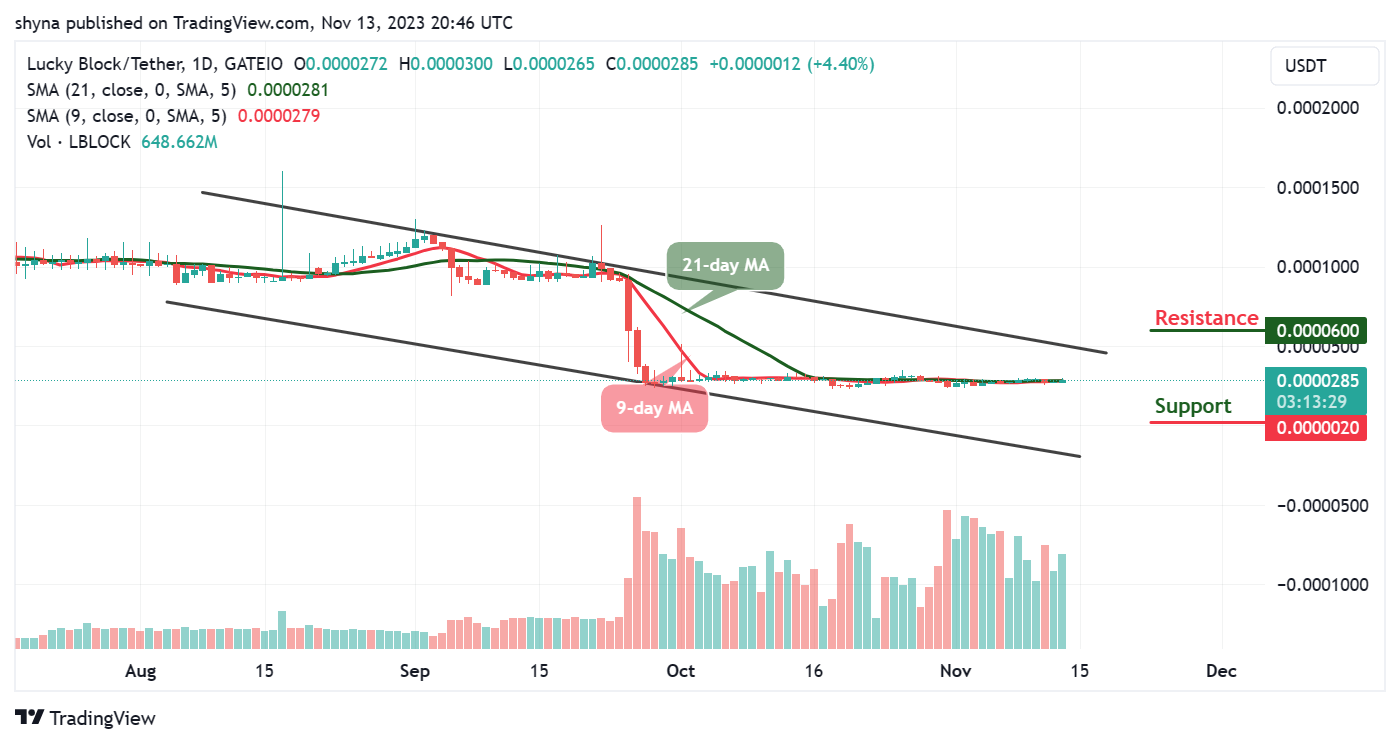
LBLOCK/USD Medium-term Trend: Ranging (1D Chart)
Key Levels:
Resistance levels: $0.000060, $0.000062, $0.000064
Support levels: $0.0000020, $0.000018, $0.000016
Looking at the daily chart, LBLOCK/USD is ranging as the coin remains above the 9-day and 21-day moving averages. A break toward the upper boundary of the channel could reach the resistance of $0.000050. However, once this comes to play out, the Lucky Block bulls will increase the buying pressure to keep the coin on the upside.
Lucky Block Price Prediction: LBLOCK/USD Trades Bullishly
The Lucky Block price will reclaim the resistance level of $0.000030 and any further bullish cross above the upper boundary of the channel could hit the potential resistance levels at $0.000060, $0.000062, and $0.000064. However, the bulls could create additional gains, if the buyers increase the pressure.
On the contrary, if the coin slides below the moving averages and heads toward the lower boundary of the channel, it could hit the support levels of $0.0000020, $0.0000018, and $0.0000016, and this could be the best time for the investor to invest in the coin.
LBLOCK/USD Medium-term Trend: Ranging (4H Chart)
The Lucky Block price is hovering above the 9-day and 21-day moving averages as the buyers increase the pressure; crossing above this barrier could locate the nearest resistance level of $0.000029. However, the 9-day MA is likely to cross above the 21-day MA, and the Lucky Block may create additional resistance levels. Meanwhile, this could be the best opportunity for buyers to re-invest and the new buyers to enter the market.
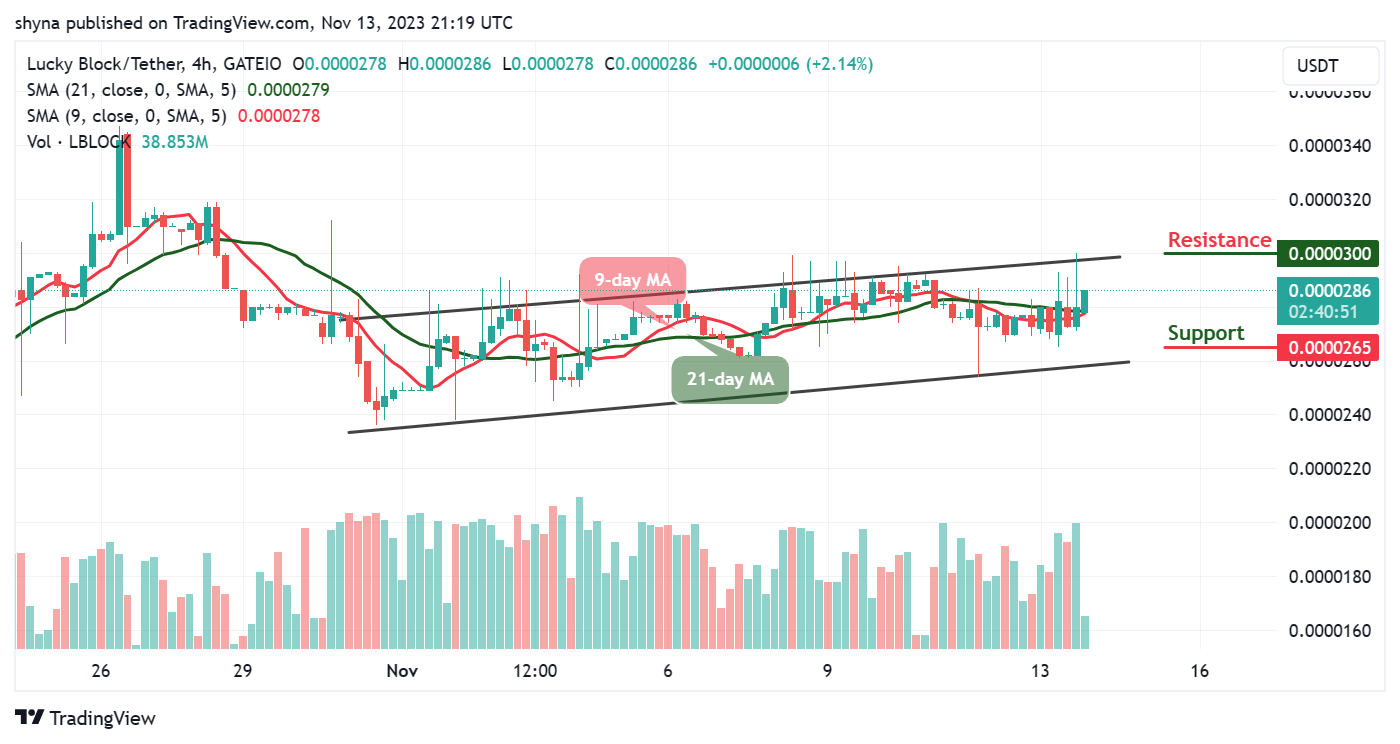
Nevertheless, if the bulls continue to push the coin above the upper boundary of the channel, the Lucky Block could hit the potential resistance level of $0.000030 and above. In other words, any bearish movement toward the lower boundary of the channel may locate the support level of $0.000026 and below.
You can purchase Lucky Block here. Buy LBLOCK