Lucky Block(LBLOCK): Steady Momentum Sets the Stage for a Bullish Move
Estimated Reading Time: 2 minutes
Don’t invest unless you’re prepared to lose all the money you invest. This is a high-risk investment and you are unlikely to be protected if something goes wrong. Take 2 minutes to learn more

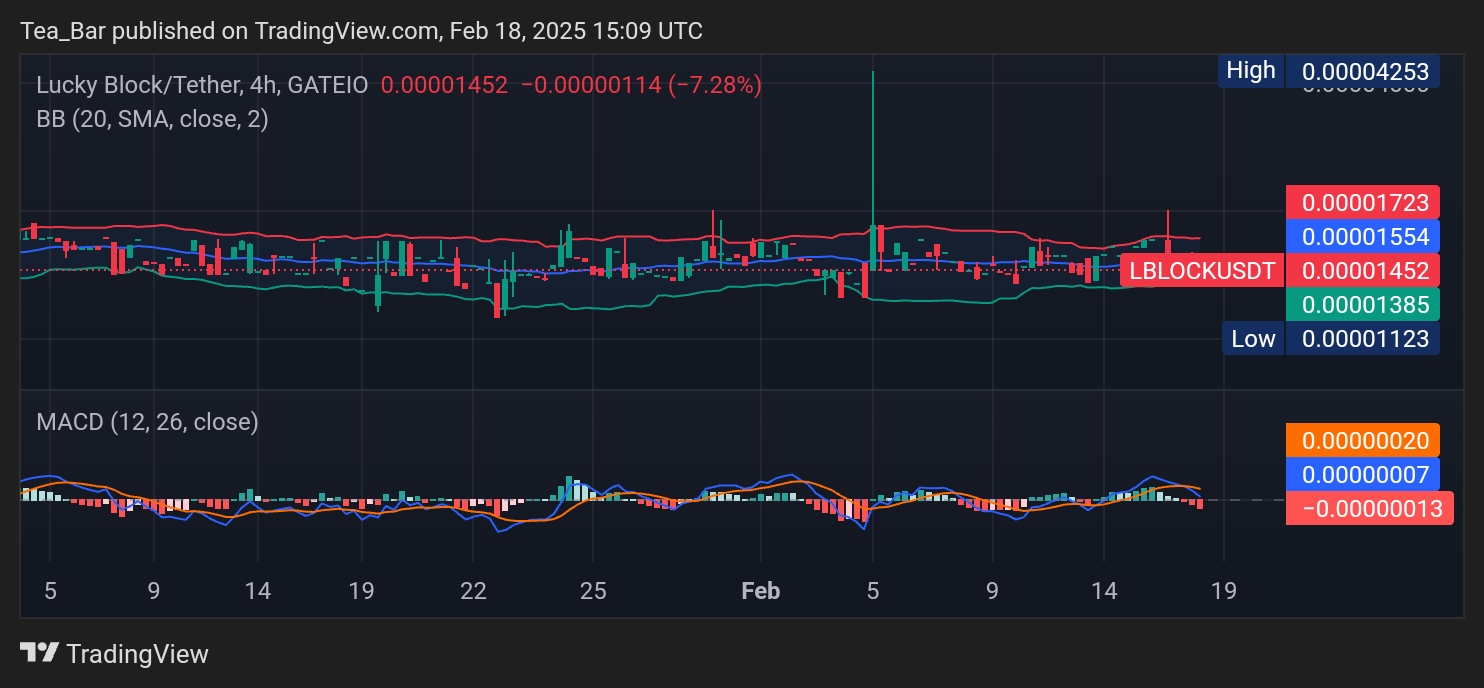
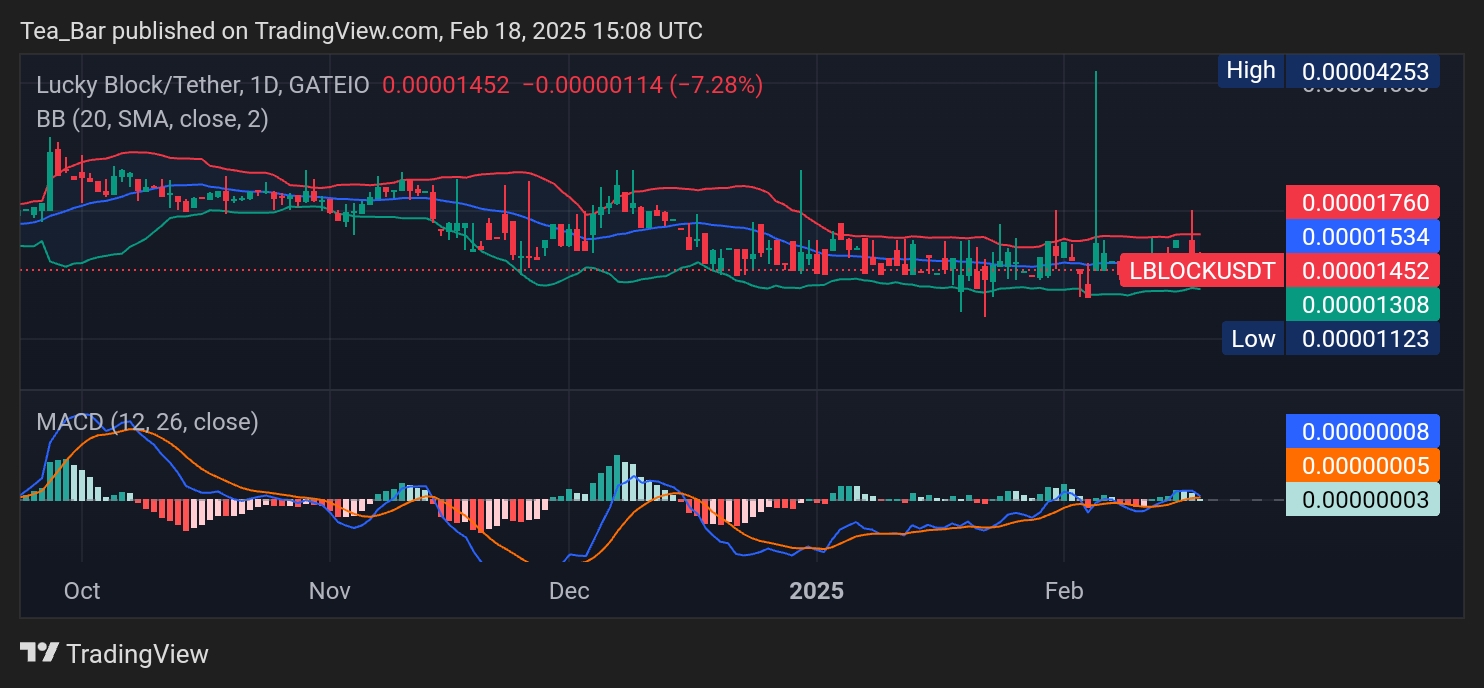
Lucky Block (LBLOCK) is holding firm despite recent price swings, currently trading at $0.00001452 after a 7.28% decline. The market may seem hesitant, but a closer look at the charts suggests potential strength brewing beneath the surface.
The Bollinger Bands on both the daily and 4-hour timeframes show a tight price range, indicating a possible volatility squeeze. Historically, such compression often precedes a breakout, which could favor bulls if momentum shifts upward.
Technical Indicators Suggest a Potential Upside
The MACD indicator is showing signs of a crossover on the daily chart, hinting at possible buying pressure. Although the histogram remains relatively neutral, a bullish flip could ignite renewed interest in LBLOCK.
Meanwhile, the support zone around $0.00001123 remains a strong foundation, as seen from past rebounds. If LBLOCK holds above this level, it could set its sights on key resistance points:
- $0.00001534 (immediate resistance)
- $0.00001760 (upper Bollinger Band level)
- $0.00004253 (historical high, signaling a major breakout zone)
What’s Next for Lucky Block?
LBLOCK continues to evolve within its ecosystem, building momentum for its next big move. With technical signals showing potential for an upward shift, traders should watch closely for a volume spike or bullish crossover on the MACD.
For those looking at long-term growth, Lucky Block’s steady base and strong support levels may present an opportunity to accumulate before the next surge. Is this the calm before the storm? Keep an eye on LBLOCK—its next move could be a game-changer!
Invest wisely, and let Lucky Block’s potential work in your favor. You can purchase Lucky Block here. Buy LBLOCK.