Chainlink Continues Sideways Move as It Is Unable to Sustain Above $8.20
Estimated Reading Time: 2 minutes
Don’t invest unless you’re prepared to lose all the money you invest. This is a high-risk investment and you are unlikely to be protected if something goes wrong. Take 2 minutes to learn more

Free Crypto Signals Channel
Chainlink (LINK) Long-Term Analysis: Ranging
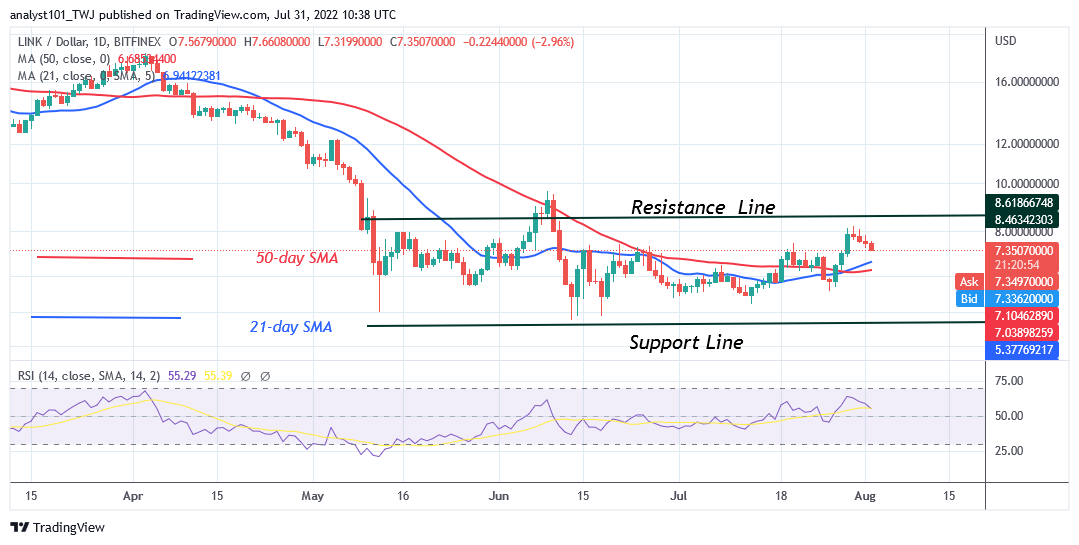
Chainlink (LINK) is in a sideways move as it is unable to sustain above $8.20. The cryptocurrency is declining after the recent rejection. On the upside, if the bulls had broken the resistance at $9.63, the market would have ralied to $12. The altcoin is declining to the downside. On the downside, if price breaks below the moving average lines, the LINK price will revisit the previous low at $5.20.
Chainlink (LINK) Indicator Analysis
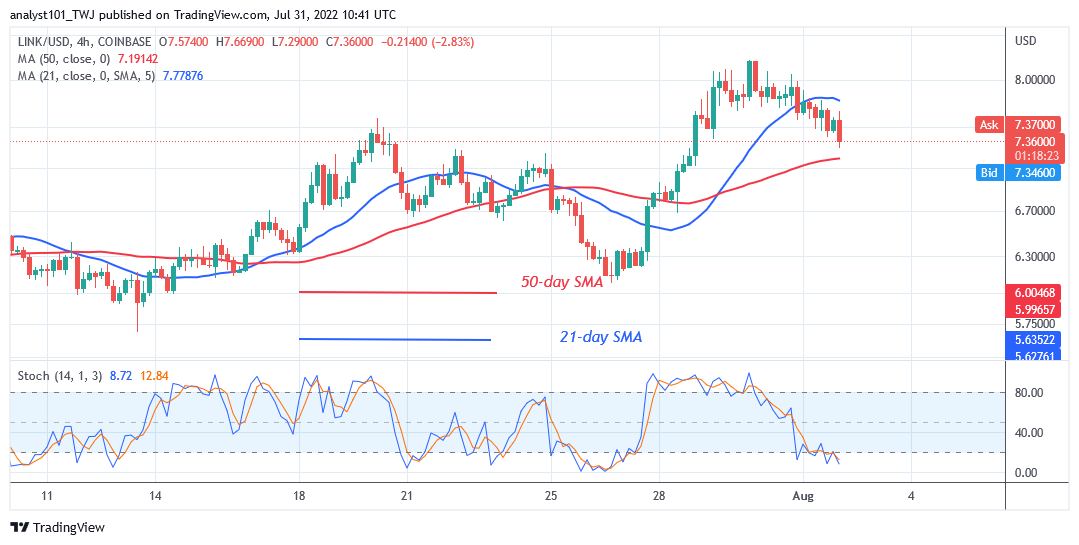
The altcoin is at level 55 of the Relative Strength Index for period 14. It indicates that the altcoin is in the bullish trend zone but faces rejection at the recent high. The 21-day line SMA and the 50-day line SMA are sloping horizontally indicating a sideways trend.A further uptrend is likely if the bullish momentum is sustained. LINK’s price bars are above the moving average lines indicating a price rise. LINK is below the 20% area of the daily stochastic. The market has reached the oversold region of the market. Buyers will emerge in the oversold region to push prices upward.
Technical indicators:
Major Resistance Levels – $18.00, $20.00, $22.00
Major Support Levels – $8.00, $6.00, $4.00
What Is the Next Direction for Chainlink (LINK)?
LINK/USD will continue the sideways move as it is unable to sustain above $8.20. The upward move will resume if the coin retraces and finds support above the moving average lines.
You can purchase crypto coins here. Buy LBlock
Note: Cryptosignals.org is not a financial advisor. Do your research before investing your funds in any financial asset or presented product or event. We are not responsible for your investing results