
Free Crypto Signals Channel
Lucky Block Price Prediction – April 17
 Most Popular
- 2-5 Signals Daily
- 82% Success Rate
- Entry, Take Profit & Stop Loss
- Amount To Risk Per Trade
- Risk Reward Ratio
The Lucky Block price prediction would begin to form higher as the coin remains above the 9-day moving average.
LBLOCK/USD Medium-term Trend: Ranging (12H Chart)
Key Levels:
Resistance levels: $0.0030, $0.0035, $0.0040
Support levels: $0.0012, $0.0008, $0.0005
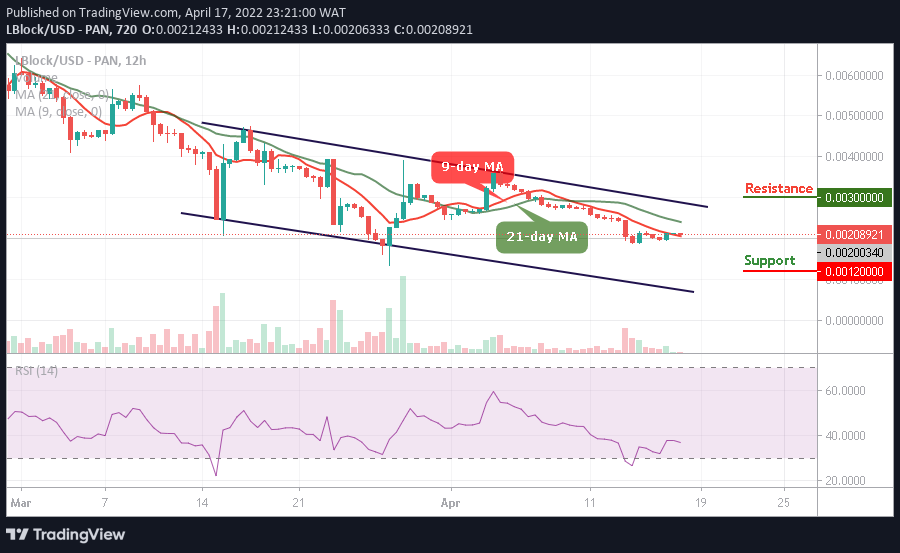
LBLOCK/USD is trading within the 9-day and 21-day moving averages as the bulls are getting ready to push the coin to the upside. The Lucky Block price may consolidate a little to allow more buyers to come into the market.
Lucky Block Price Prediction: Green Days Are Coming for LBLOCK/USD
The Lucky Block price would break above the 21-day moving average as soon as the bulls defend the $0.0020 support level. Therefore, any further bullish movement towards the upper boundary of the channel may push the coin to the potential resistance levels of $0.0030, $0.0035, and $0.0040.
For now, this technical analysis may be delayed a little bit if the bears keep the coin below the 21-day moving average and could fall to the support levels of $0.0012, $0.0008, and $0.0005. Moreover, the technical indicator Relative Strength Index (14) is moving below the 40-level preparing the coin for the bullish movement.
LBLOCK/USD Medium-term Trend: Ranging (4H Chart)
When compared to the 4-hour chart, the Lucky Block price would move up higher as the coin gets ready for a cross above the upper boundary of the channel. However, the long-term moving averages may keep the bullish movement as the market prepares for a new trend.
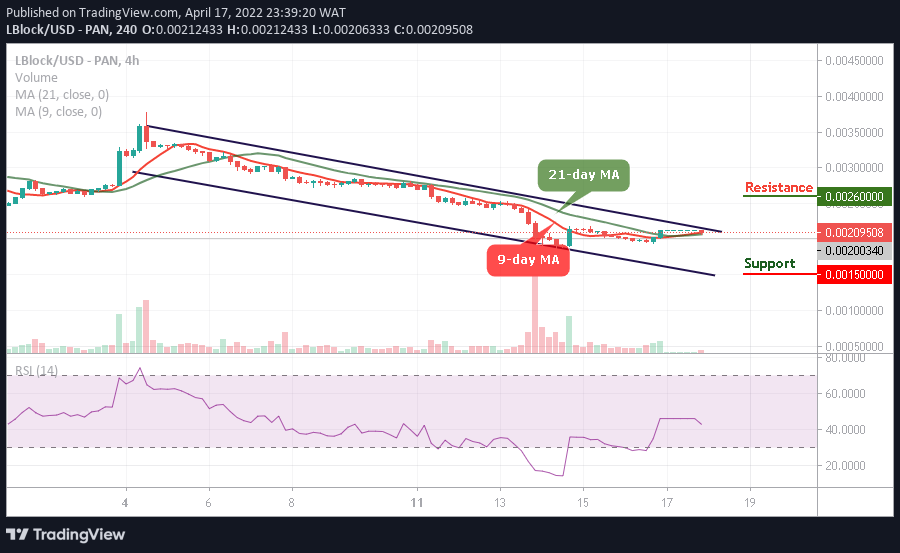
On the other hand, if the buyers keep the price above the 9-day and 21-day moving averages; higher resistance could be located at $0.0026 and above. However, the technical indicator Relative Strength Index (14) moves above the 40-level, and should the bulls fail to move the current market value up, the bears may step into the market, and the nearest support level could be found at $0.0015 and below.
Read more:
