Lucky Block (LBLOCK): Bullish Reversal Signals Flash Amid Market Dip
Estimated Reading Time: 3 minutes
Don’t invest unless you’re prepared to lose all the money you invest. This is a high-risk investment and you are unlikely to be protected if something goes wrong. Take 2 minutes to learn more

Lucky Block (LBLOCK), the blockchain-based lottery and gaming token, is navigating a promising technical setup despite the broader market downturn. Trading at $0.00003433 as of July 30, 2025, LBLOCK appears to be forming a solid base for reversal. With bullish signals emerging on both the daily and 4-hour charts, this current dip may not be a warning sign—but rather a golden entry opportunity for forward-looking traders.
Daily Chart: Oversold Pressure Building for Breakout
The daily chart paints a picture of recovery in motion. LBLOCK plunged to a painful low of $0.00001500 in June, but that proved to be a major turning point. Since then, price has bounced over 37% and is now holding steadily above the $0.00002500 support level. The Relative Strength Index (RSI) sits at 34.64, which places it well within oversold territory. Historically, such levels have signaled market bottoms for LBLOCK, and the presence of “Bull” and “Buy” tags on the chart further reinforce that narrative.
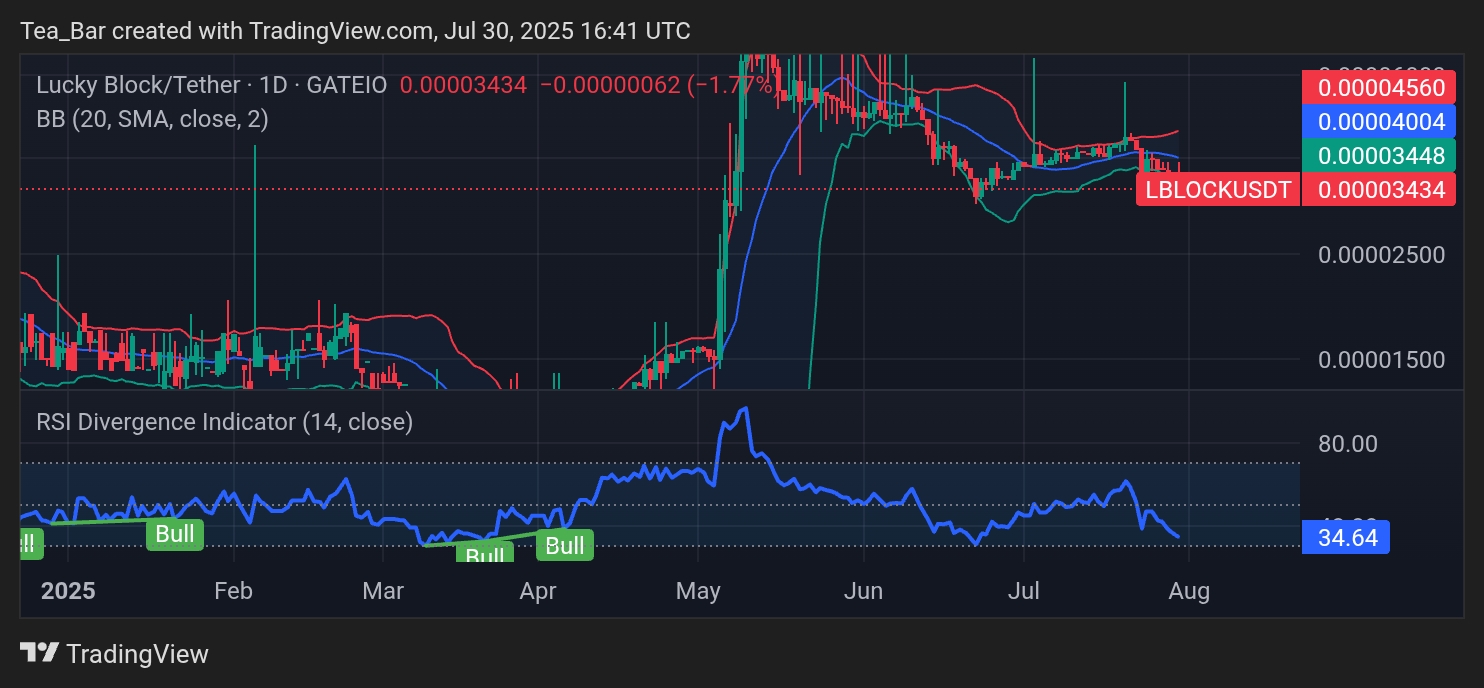
Price is also riding along the lower Bollinger Band, which often indicates a market squeeze is underway. This compression phase tends to precede significant breakouts, and with the current setup, a move above $0.00003448 could quickly trigger momentum toward $0.00004004. That threshold may act as a psychological pivot point, potentially shifting sentiment in favor of a broader recovery.
4-Hour Chart: Bullish Divergence Quietly Unfolding
On the 4-hour chart, the structure becomes even more compelling. While LBLOCK recently dipped to $0.00003261, the RSI climbed to 38.20—indicating a clear bullish divergence. This suggests that even as price moved lower, momentum was subtly shifting in favor of buyers. Support at $0.00003261 is being strongly defended, with multiple higher lows hinting that sellers are running out of steam.
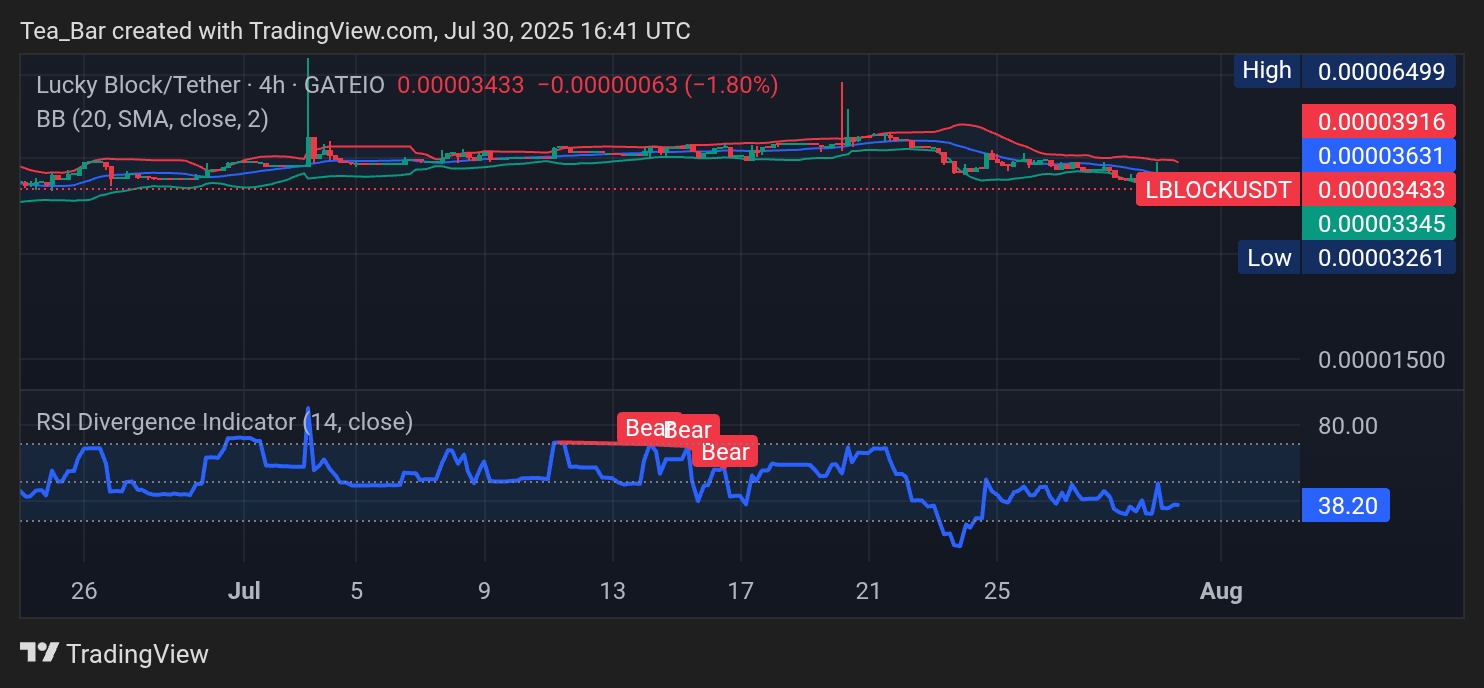
The Bollinger Bands are narrowing further, signaling an impending volatility expansion. Price is now flirting with the $0.00003439 resistance zone, which, if breached, could release pent-up bullish energy. Even the presence of short-term “Bear” signals appears increasingly irrelevant in the face of growing accumulation and structural strength across the chart.
Conclusion: Conditions Ripe for a Lucky Block Breakout
Lucky Block is at a promising inflection point, where oversold conditions meet subtle bullish structure. With strong support levels intact, RSI divergence unfolding, and Bollinger Band compression setting the stage, LBLOCK looks primed for a sharp upside move. Traders watching from the sidelines may find this technical alignment too good to ignore.
Invest wisely, and let Lucky Block’s potential work in your favor. You can purchase Lucky Block here. Buy LBLOCK.