Lucky Block (LBLOCK): Could This Be the Start of a Bullish Breakout?
Estimated Reading Time: 3 minutes
Don’t invest unless you’re prepared to lose all the money you invest. This is a high-risk investment and you are unlikely to be protected if something goes wrong. Take 2 minutes to learn more

Lucky Block (LBLOCK), now trading at $0.00002369, shows signs of potential recovery despite a modest 1.13% dip in the last 24 hours. The price action suggests a temporary pause, but the charts point toward a promising shift in momentum. Let’s break down the daily and 4-hour charts to explore what’s on the horizon for LBLOCK.
Ready for Takeoff? 1-Day Chart Insights
On the 1-day chart, LBLOCK has retraced slightly from its high of $0.00003300 to its current level of $0.00002369, yet remains primed for a resurgence. The Parabolic SAR dots rest beneath the price, indicating that bullish momentum is still very much in play. This signals that buyers could be gearing up for another push.
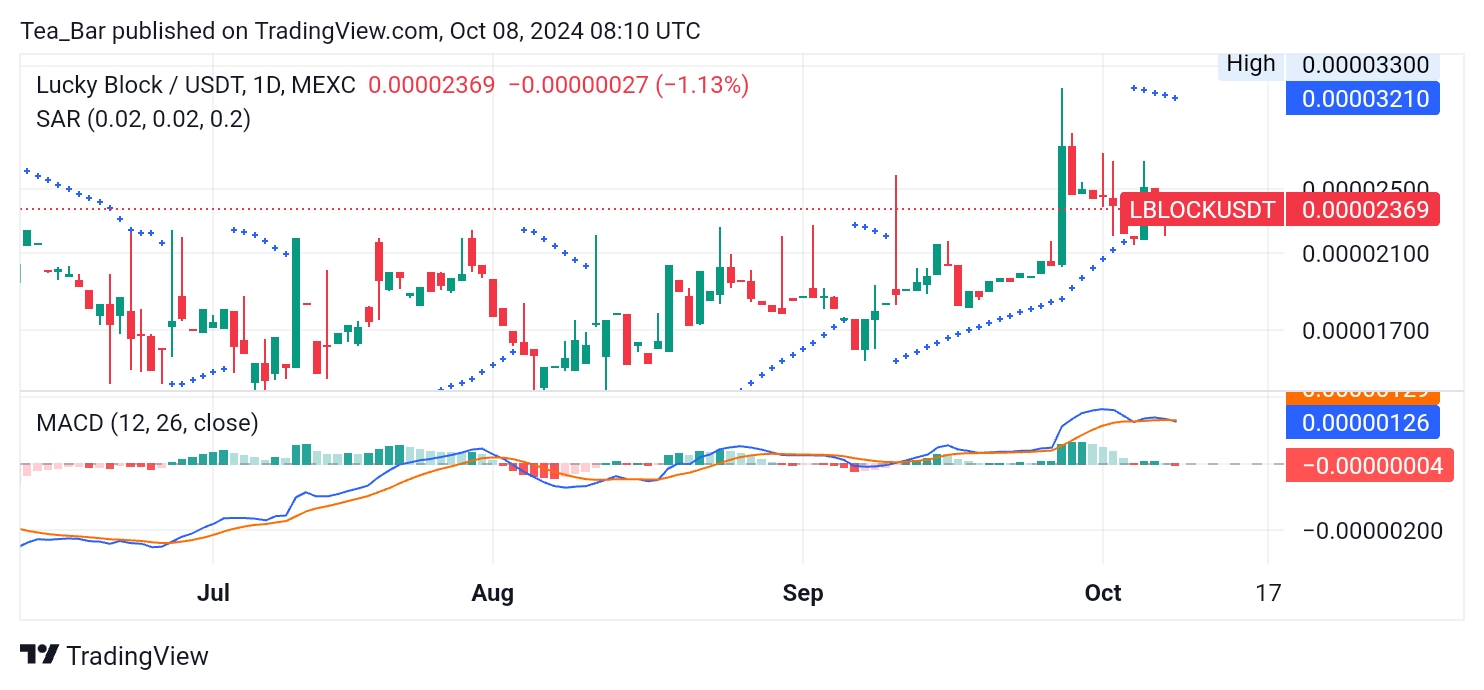
The MACD indicator is showing signs of a potential crossover, which, if it occurs, could fuel the next leg up. With support holding strong around $0.00001700, the next resistance target of $0.00003330 is well within reach if buying pressure resumes. A solid push from here could open the doors to even more upward movement, suggesting a bright path ahead for LBLOCK.
Is a Short-Term Rally Brewing? 4-Hour Chart Analysis
The 4-hour chart offers a snapshot of a market that may be gearing up for a short-term rally. Although Parabolic SAR dots have recently flipped above the price, signaling temporary resistance, this only highlights a brief cooldown. The MACD has seen a minor dip but is positioned to quickly recover, offering an ideal opportunity for traders to eye the next potential breakout.
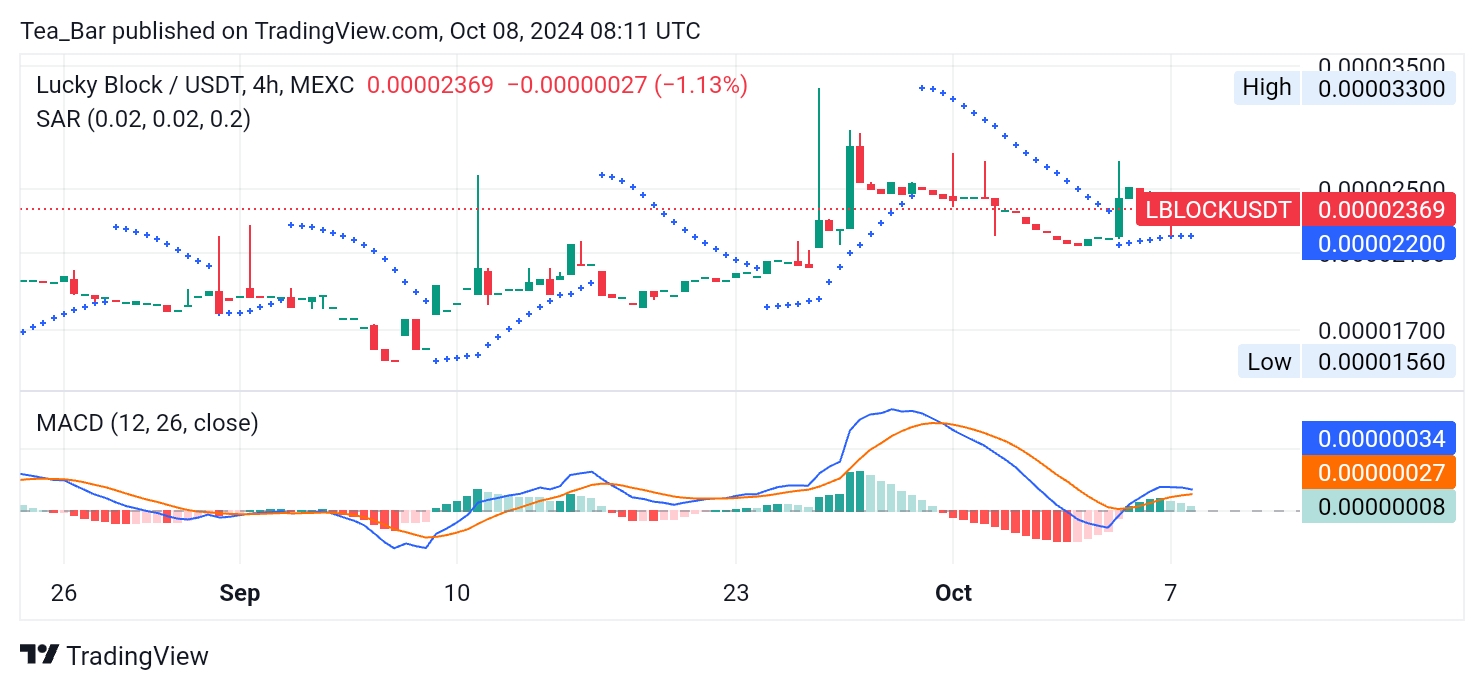
With support sitting comfortably at $0.00002200, LBLOCK is in a favorable spot to make a push towards $0.00002500 in the near future. All it takes is a bit of momentum to shift the tide, which seems increasingly possible given the coin’s overall resilience.
What Lies Ahead for LBLOCK? Future Outlook
Looking ahead, Lucky Block is in a prime position for a rebound. With strong support levels holding firm, the chance for a breakout towards $0.00003330 is growing stronger by the day. A recovery wave could bring back positive momentum, attracting both long-term holders and short-term traders alike.
In summary, while LBLOCK is experiencing a brief cooldown, the bigger picture remains promising. Indicators suggest that a rally could be just around the corner, setting up the coin for a renewed uptrend. As Lucky Block continues to show resilience, it presents an exciting opportunity for those looking to benefit from its potential upswing.
You can purchase Lucky Block here. Buy LBLOCK.