Lucky Block (LBLOCK) Gears Up for Potential Breakthrough
Estimated Reading Time: 3 minutes
Don’t invest unless you’re prepared to lose all the money you invest. This is a high-risk investment and you are unlikely to be protected if something goes wrong. Take 2 minutes to learn more

The Lucky Block (LBLOCK) token has experienced some fluctuation in recent days, but its current technical outlook suggests there could be potential for a positive shift. Despite a slight decline of 1.26%, the charts hint at some encouraging signs for those closely following LBLOCK’s price movement.
LBLOCK Daily Chart Analysis
On the daily chart, Lucky Block is trading at $0.00001963, showing resilience amid recent pullbacks. The Parabolic SAR indicator suggests a gradual shift in the trend, as dots continue to form below the price candles. This pattern typically signals a potential upward movement, which could hint at a bullish breakout if the trend sustains.
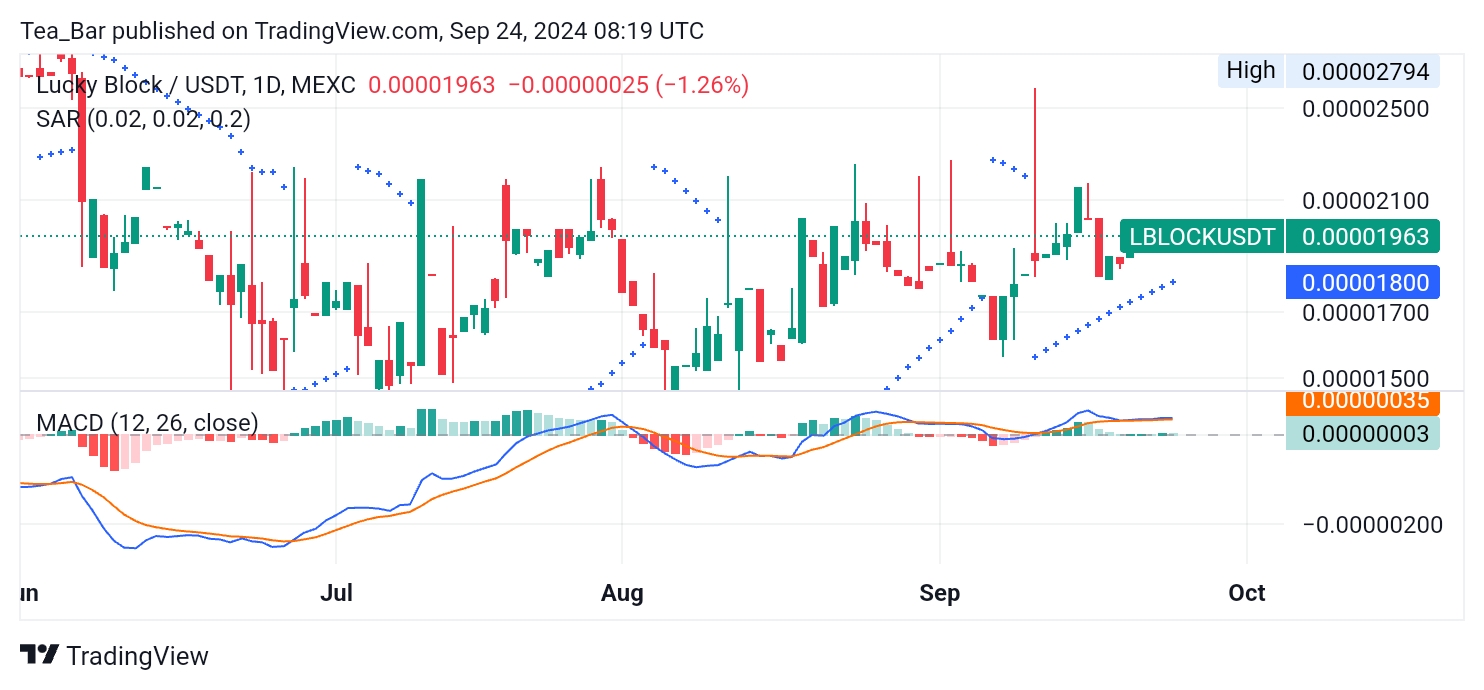
The MACD (Moving Average Convergence Divergence) is showing a relatively neutral sentiment, though there’s a sign of convergence between the MACD and signal lines. Should this crossing occur, it may confirm the start of a positive momentum in the coming days. Key resistance levels are seen around $0.00002100, while support sits around $0.00001700, offering room for potential growth.
4-Hour Chart Overview for LBLOCK
Zooming into the 4-hour chart, LBLOCK is also holding steady at $0.00001963. The Parabolic SAR continues to signal bullish potential, with dots firmly beneath the price. Notably, the MACD has shown an interesting development as it hovers close to a crossover, which may lead to positive price action in the short term.
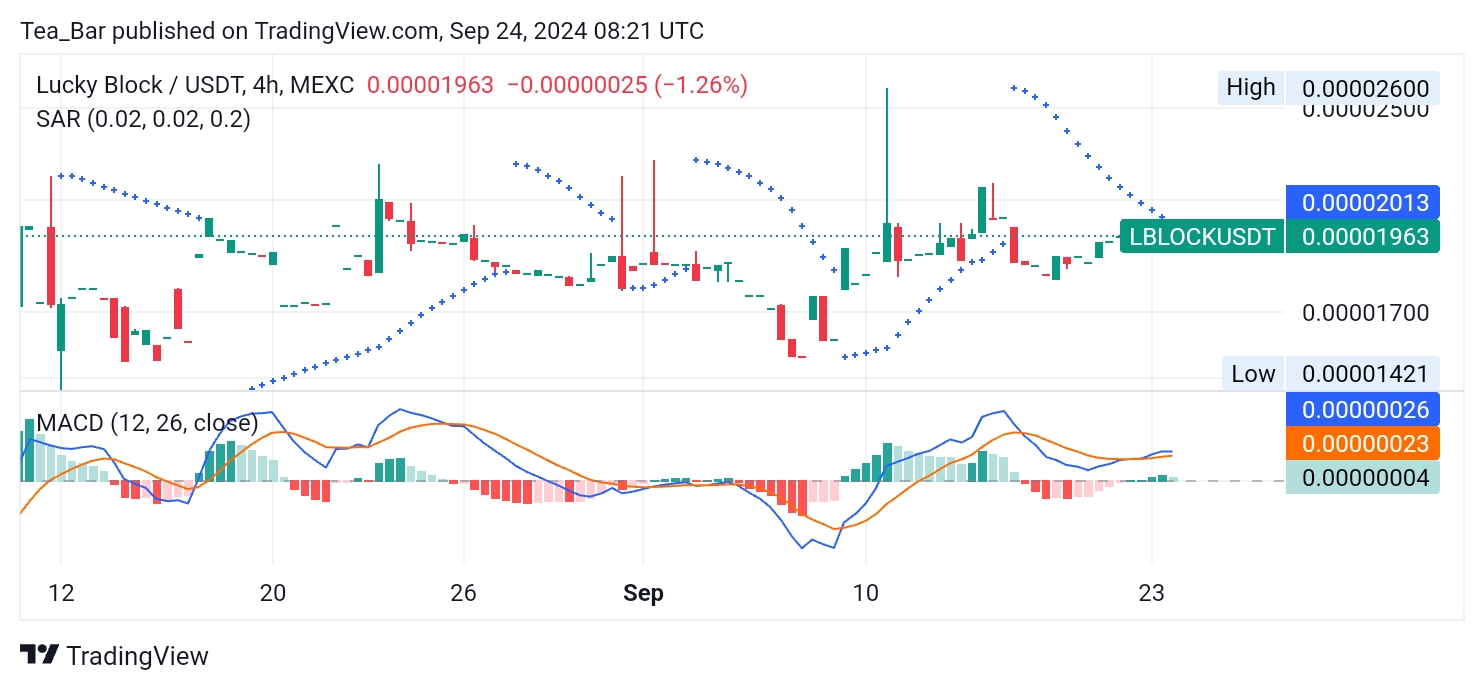
The resistance level for LBLOCK on this time frame is seen at $0.00002013, while support lies at $0.00001700. The market’s stability around these levels suggests that any breakout past resistance could lead to a swift upward surge, potentially making LBLOCK a watch-worthy asset in the short run.
Positive Outlook for Lucky Block
Despite minor setbacks, LBLOCK maintains a promising structure on both the daily and 4-hour charts. Investors and traders alike should keep an eye on the MACD indicator and Parabolic SAR for further confirmation of potential upward movement. If LBLOCK breaks past its immediate resistance zones, it may mark the start of a new uptrend, which could see prices climbing further in the near future.
You can purchase Lucky Block here. Buy LBLOCK.