$SPONGE/USD Market Update: Path to $0.0008 Amidst Volatility
Estimated Reading Time: 3 minutes
Don’t invest unless you’re prepared to lose all the money you invest. This is a high-risk investment and you are unlikely to be protected if something goes wrong. Take 2 minutes to learn more
The SPONGE/USD pairing has continued to defy expectations as the bull market steers closer to the $0.0008 mark. Initial projections pinpointed the $0.00055 price threshold as the next focal point; however, the market showcased its resilience by experiencing negligible bearish pushback. This strength became particularly evident as the price not only surpassed the $0.0006 barrier but did so with ease, echoing the earlier patterns seen around the $0.00055 level.
Key Market Indicators:
- Resistance Levels: $0.00047, $0.00050, and $0.00060.
- Support Levels: $0.000350, $0.00030, and $0.00025.
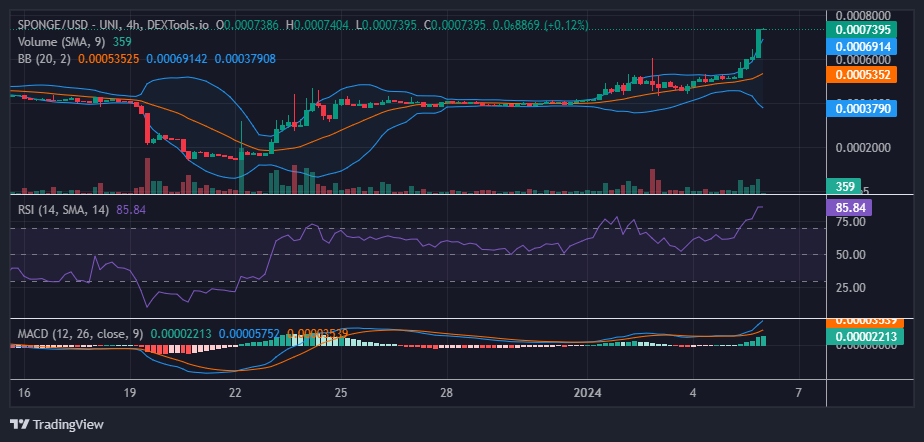
In-depth Technical Analysis for $SPONGE (SPONGE/USD):
The breach beyond the $0.0006 resistance ushered in a flurry of buying actions, amplifying the prevailing bullish sentiment. While such vigorous upward trajectories can invite bearish counteractions, the SPONGE/USD market remains predominantly optimistic. Notably, the recent 4-hour session hints at the emergence of a four-price doji—a potential precursor to bearish movements. Complementing this observation, the Relative Strength Index (RSI) positions the market within the overbought zone, signaling a looming correction. Yet, despite these indicators, the overarching sentiment leans bullish, with $0.0006 and $0.00055 poised as potential support markers.
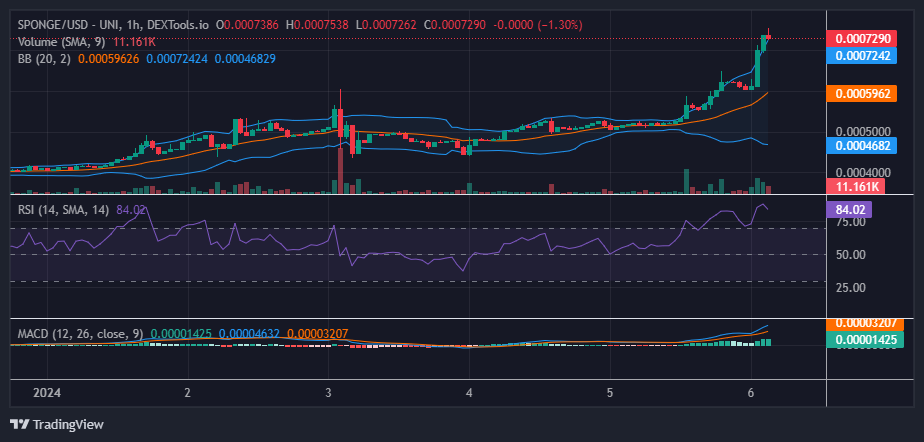
Insights from the 1-Hour Perspective:
A closer inspection of the 1-hour chart, as indicated by the Bollinger Bands, reveals heightened volatility in the wake of recent bullish endeavors. The pronounced divergence in the upper standard deviation curve relative to its lower counterpart accentuates the dominant bullish narrative. Should the market witness a downturn, the $0.0006 and $0.00055 levels are anticipated to serve as pivotal zones, attracting renewed bullish interest.
With an even larger campaign for SpongeV2, we’re coming back stronger than ever!
🚀 Missed Sponge V1’s 100x Success?
With an even larger campaign for #SpongeV2, we’re coming back stronger than ever! 💪
Hurry and stake your $SPONGE tokens today! 🔥$SPONGE #Crypto #CryptoStaking pic.twitter.com/QIo0RMz4LT
— $SPONGE (@spongeoneth) January 6, 2024
Invest in the hottest and best meme coin. Buy Sponge ($SPONGE) today!