Tamadoge (TAMA/USD) Continues to Hold at the $0.00040 Price Level
Estimated Reading Time: 3 minutes
Don’t invest unless you’re prepared to lose all the money you invest. This is a high-risk investment and you are unlikely to be protected if something goes wrong. Take 2 minutes to learn more
Tamadoge (TAMA/USD) continues to trade sideways, clinging tightly to the pivotal $0.00040 support zone. However, growing bearish momentum is casting a shadow over this level, raising concerns—especially given that the market recently tested the $0.00038 area.
Despite sellers’ pressure, buyers have shown consistent resilience. The repeated defense of this zone suggests growing bullish strength, which could eventually fuel a breakout and drive the price toward the $0.00055 resistance level. Notably, strong buying interest appears to be forming around the $0.00038 mark—just below the key support—further reinforcing the potential for a bullish reversal.
At this stage, traders should closely monitor price behavior around the $0.00040 level, as its stability is crucial for maintaining the market’s short-term bullish structure.
Key Price Zones to Watch
- Resistance: $0.00045, $0.00050, $0.00055
- Support: $0.00035, $0.00030, $0.00025
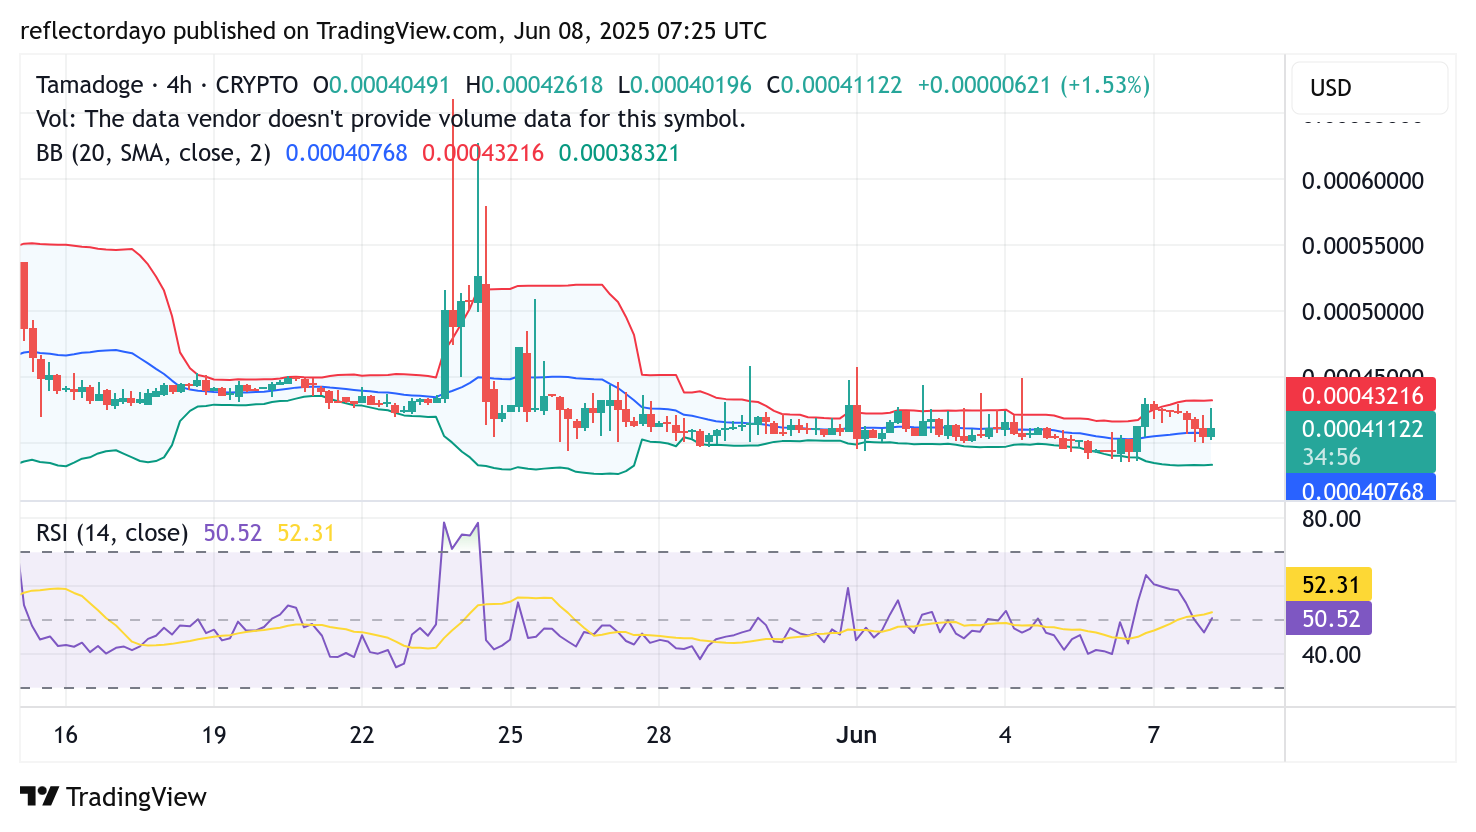
Tamadoge (TAMA/USD) Technical Structure Signals Potential Rebound as Bulls Defend Key Levels
Tamadoge (TAMA/USD) continues to validate the $0.00041 level as a key support zone, providing a solid foundation for recent market activity. Over the past few sessions, price action has made several brief pullbacks to this level—an indication that buying interest remains active.
Recently, the market surged toward the $0.00043 resistance area but encountered selling pressure, which triggered a minor pullback. However, bullish sentiment around the $0.00041 zone has managed to keep the market afloat, with lower support levels at $0.00040 and $0.00038 still considered strongholds for the bulls.
If the $0.00041 support fails to hold, a bounce from $0.00040 could serve as the next likely rebound point, potentially reigniting upward momentum and preserving the short-term bullish structure.
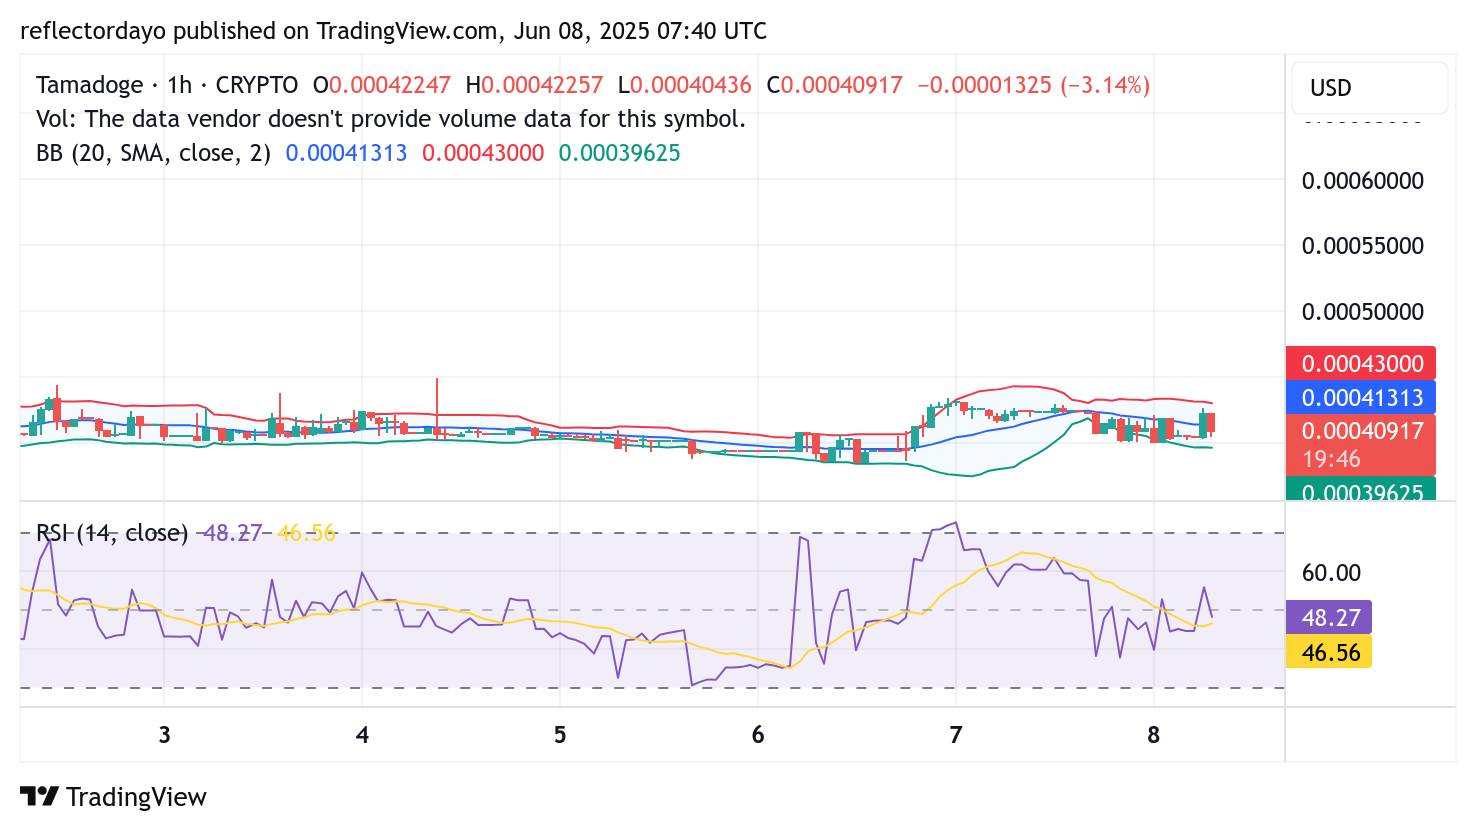
TAMA/USD Intraday Outlook – 1-Hour Chart: Bulls Hold $0.0004 as Volatility Begins to Rise
On the 1-hour chart, TAMA/USD remains in a narrow consolidation phase, with price action consistently orbiting the $0.0004 support level. This prolonged equilibrium suggests a temporary standoff between bullish and bearish forces, as neither side has yet taken full control.
Unlike the previous analysis, which highlighted the formation of four-price doji candlesticks—signs of market indecision—recent candles are now showing increased volume, indicating that volatility is picking up. Although supply and demand still appear evenly matched, the growing momentum hints at an imminent breakout.
This evolving setup could be the precursor to the next significant move in the Tamadoge market. Traders should stay alert, as rising volatility often precedes decisive price action.
Buy TAMA/USD!
There’s no mobile runner out there quite like #TamadogePursuit! 🏃♂️
1️⃣ Sign up – start with 20 free credits for a boost!
2️⃣ Climb up the leaderboards.
3️⃣ Win $TAMA rewards!Play Now! 👇
📱Android: https://t.co/Of8SYALRzL
📱 iOS: https://t.co/IthvqovwAH pic.twitter.com/84HNqob9Rf— TAMADOGE (@Tamadogecoin) September 10, 2024