Polkadot (DOT) Declines as Buyers Encounter Rejection at $14.10 High
Estimated Reading Time: 3 minutes
Don’t invest unless you’re prepared to lose all the money you invest. This is a high-risk investment and you are unlikely to be protected if something goes wrong. Take 2 minutes to learn more
Polkadot (DOT) Long-Term Analysis: Bearish
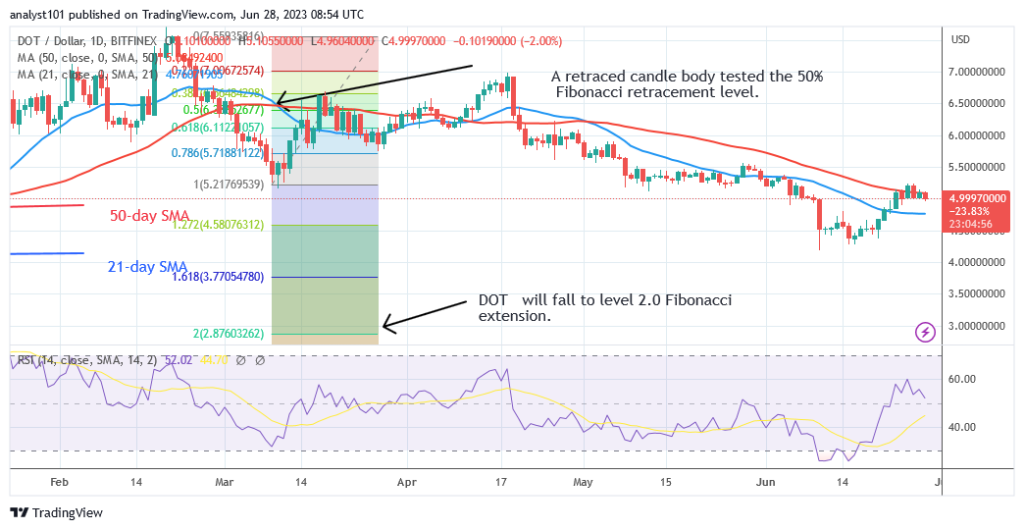
Polkadot’s (DOT) price is falling and about to break below the previous low at $13.09. The selling pressure will resume if price breaks below the previous low. Since June 22, Polkadot fell to the previous low and resumed correction upward. The upward correction was terminated as price resumed fluctuation between $13.50 and $17. For the past two weeks, Polkadot has been confined in a range. Today, the DOT price is attempting to break below the previous low. Meanwhile, on June 23 downtrend, a retraced candle body tested the 78.6% Fibonacci retracement level. The retracement indicates that DOT price will fall but reverse at level 1.272 Fibonacci extension or level $9.98. From the price action, DOT price is in a downward move
Polkadot (DOT) Indicator Analysis
DOT price is at level 35 of the Relative Strength Index period 14. It indicates that the altcoin is in the downtrend zone and below the centerline 50. However, crypto is approaching the oversold region of the market. DOT price is above the 25% range of the daily stochastic. It is in a bullish momentum but the stochastic bands are fluctuating below and above the oversold region. The 21-day and 50-day SMAs are sloping southward.

Technical indicators:
Major Resistance Levels – $48, $52, $56
Major Support Levels – $32, $28, $24
What Is the Next Direction for Polkadot (DOT)?
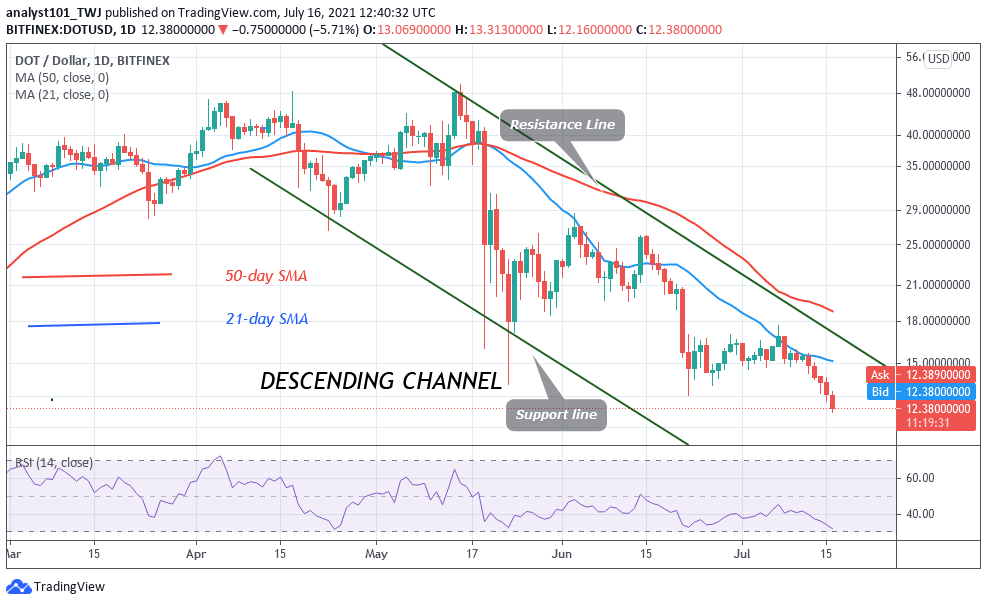
Polkadot is in a downward move. On the 4 hour chart, DOT price fell to $13.10 support and pulled back. Meanwhile, on July 14 downtrend; a retraced candle body tested the 78.6% Fibonacci retracement level. The retracement indicates that DOT price will fall but reverse at level 1.272 Fibonacci extension or level $12.43. From the price action, DOT price is in a downward move.

You can purchase crypto coins here. Buy Tokens
Note: Cryptosignals.org is not a financial advisor. Do your research before investing your funds in any financial asset or presented product or event. We are not responsible for your investing results