Polkadot (DOT) Declines, Unable to Sustain above $26
Estimated Reading Time: 2 minutes
Don’t invest unless you’re prepared to lose all the money you invest. This is a high-risk investment and you are unlikely to be protected if something goes wrong. Take 2 minutes to learn more
Polkadot (DOT) Long-Term Analysis: Bearish
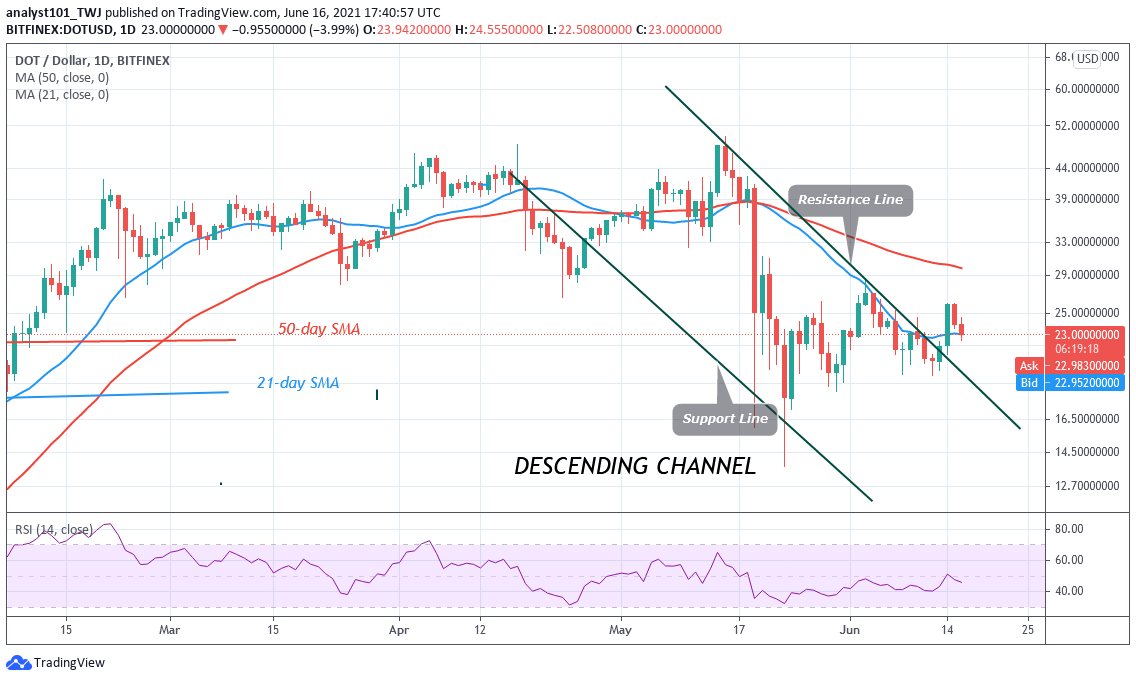
Polkadot (DOT) has been in an upward correction for the past three days. The upward correction was terminated at the high of $26. The crypto would have resumed an uptrend if buyers are successful above $26 high. DOT price has retraced to the support of the 21-day SMA. The uptrend will resume if the 21-day SMA supports holds. The selling pressure will resume if price breaks below the moving averages.
Polkadot (DOT) Indicator Analysis
DOT price is at level 45 of the Relative Strength Index period 14. It indicates that the altcoin is in the downtrend zone and below the centerline 50. The coin is below the 40% range of the daily stochastic. It indicates that the market is in a bearish momentum. The coin is approaching the oversold region of the market. The 21-day and 50-day SMAs are sloping horizontally.

Technical indicators:
Major Resistance Levels – $48, $52, $56
Major Support Levels – $32, $28, $24
What Is the Next Direction for Polkadot (DOT)?
Polkadot is in a downward move. On the 4 hour chart, the DOT price is falling after reaching the high of $26. On June 4 downtrend; a retraced candle body tested the 61.8% Fibonacci retracement level. This indicates that DOT price will fall to level 1.618 Fibonacci extension or level $20.72.

Note: new.cryptosignals.org is not a financial advisor. Do your research before investing your funds in any financial asset or presented product or event. We are not responsible for your investing results