Polkadot (DOT) In a Downward Correction, Retraces to Previous Low at $13
Estimated Reading Time: 2 minutes
Don’t invest unless you’re prepared to lose all the money you invest. This is a high-risk investment and you are unlikely to be protected if something goes wrong. Take 2 minutes to learn more
Polkadot (DOT) Long-Term Analysis: Bearish
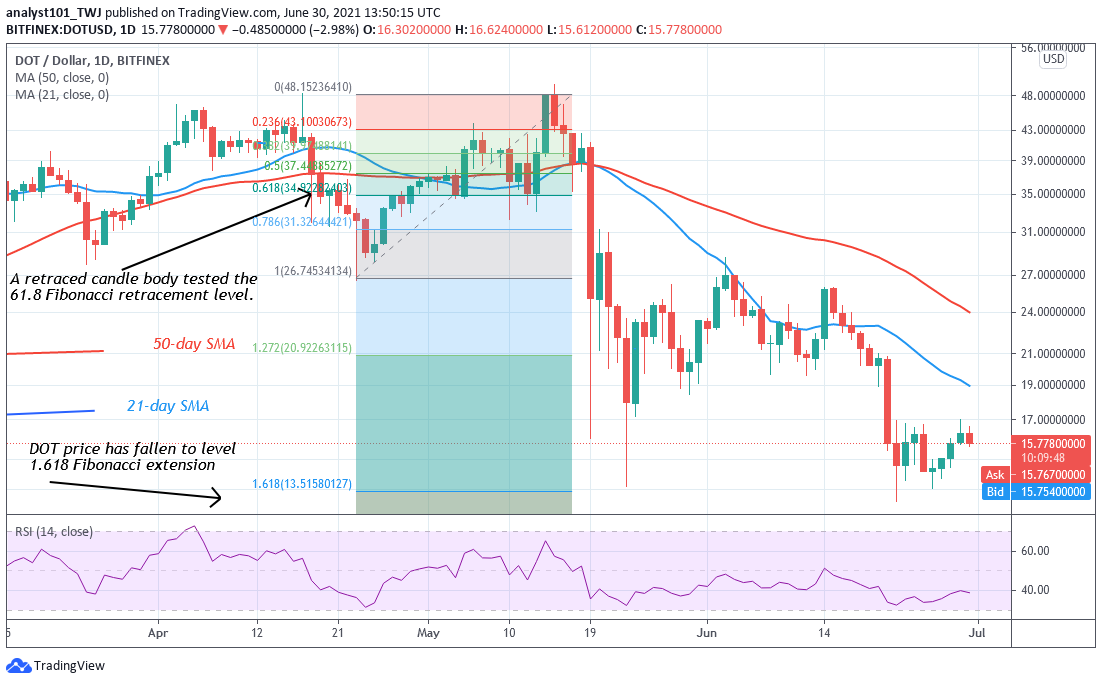
Polkadot (DOT) is in a downward correction. Since June 22, the upward move has been restricted below the resistance at $17.00. Today, the altcoin is falling after retesting the recent high. Meanwhile, on April 23 downtrend, a retraced candle body tested the 61.8 Fibonacci retracement level. The retracement indicates that DOT price has fallen to level 1.618 Fibonacci extension or level $13.51. From the price action, the market retested the Fibonacci level and pulled back.
Polkadot (DOT) Indicator Analysis
DOT price is at level 38 of the Relative Strength Index period 14. It indicates that the altcoin is in the downtrend zone and below the centerline 50. DOT price is below the 80% range of the daily stochastic, It indicates that the market is in a bearish momentum. The selling pressure has been exhausted. The 21-day and 50-day SMAs are sloping southward.

Technical indicators:
Major Resistance Levels – $48, $52, $56
Major Support Levels – $32, $28, $24
What Is the Next Direction for Polkadot (DOT)?
Polkadot is in a downward move at the bottom of the chart. The altcoin has been fluctuating between levels $13.50 and $16.50. Each time, DOT price retest the resistance at $16.50, the market will decline. On June 8 downtrend; a retraced candle body tested the 61.8% Fibonacci retracement level. This retracement indicates that DOT price will fall to level 1.618 Fibonacci extension or level $14.02.

You can purchase crypto coins here. Buy Tokens
Note: new.cryptosignals.org is not a financial advisor. Do your research before investing your funds in any financial asset or presented product or event. We are not responsible for your investing results