Polkadot Rebounds but Hits the Obstacle at $7.30
Estimated Reading Time: 2 minutes
Don’t invest unless you’re prepared to lose all the money you invest. This is a high-risk investment and you are unlikely to be protected if something goes wrong. Take 2 minutes to learn more

Polkadot (DOT) Long-Term Analysis: Bearish
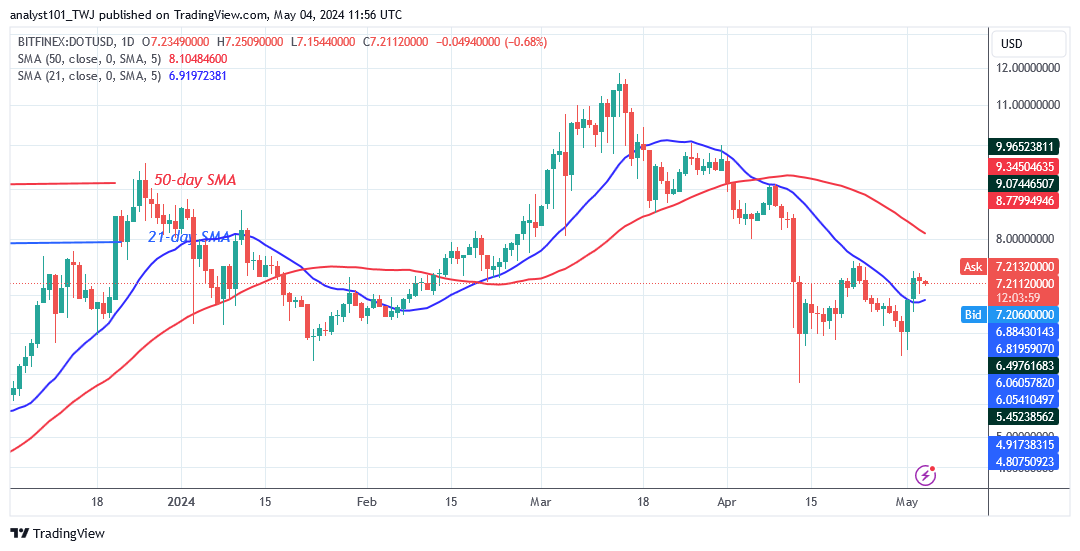
Polkadot’s (DOT) price moves in a range-bound manner above the $6.20 support but hits the obstacle at $7.30. The current sideways trend has been broken, with the price breaking above the 21-day SMA. Following the breakout on May 2, 2024, the DOT price is likely to move above the 50-day SMA, which represents the resistance at $8.13.
The bullish scenario will be realized if buyers break above the initial hurdle at $7.41. The crypto price is currently retreating toward the 21-day SMA support. If the cryptocurrency retraces and maintains above the 21-day SMA, it must continue volatility between the moving average lines. Selling pressure will return if the price falls below the 21-day SMA. Polkadot was trading at $7.21 at the time of publication.
Technical indicators:
Major Resistance Levels – $10, $12, $14
Major Support Levels – $8, $6, $4
Polkadot (DOT) Indicator Analysis
Polkadot is above the 21-day SMA but below the 50-day SMA, indicating that the cryptocurrency could fluctuate. The 21-day SMA is the resistance level that was broken, paving the way for the upward movement. The crypto continues to face upside rejection.
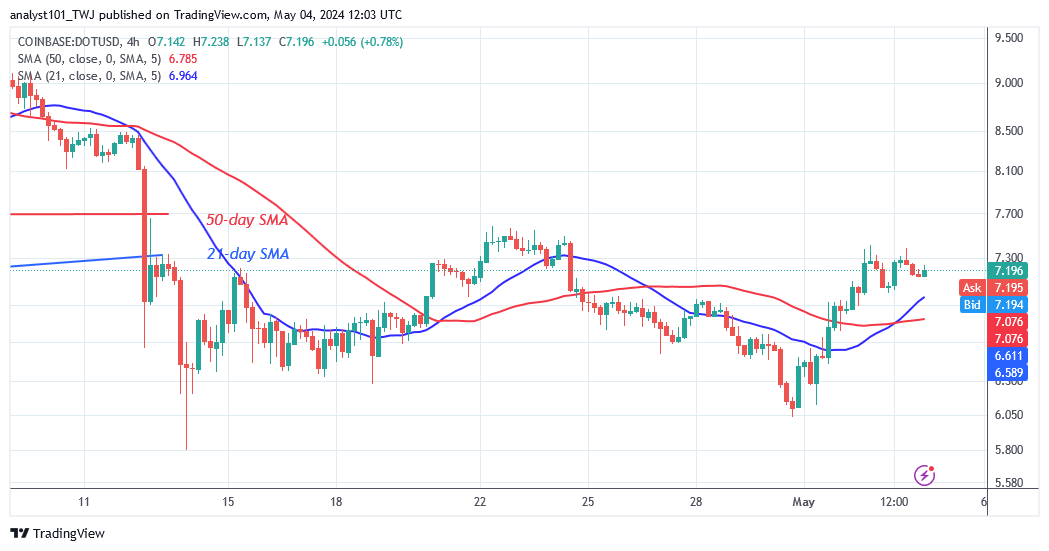
What Is the Next Direction for Polkadot (DOT)?
Polkadot continues its upward trend following a rebound above the $6.14 support but hits the obstacle at $7.30. On the 4-hour chart, the cryptocurrency price is stalled after a false breakout above the $7.30 resistance. The DOT price is oscillating below the current high following its rejection at the recent high. The cryptocurrency signal will fluctuate till the uptrend resumes.
You can purchase Lucky Block here. Buy LBLOCK
Note: Cryptosignals.org is not a financial advisor. Do your research before investing your funds in any financial asset or presented product or event. We are not responsible for your investing results