Quant (QNT) Shows Signs of Recovery Amid Bearish Trends
Estimated Reading Time: 3 minutes
Don’t invest unless you’re prepared to lose all the money you invest. This is a high-risk investment and you are unlikely to be protected if something goes wrong. Take 2 minutes to learn more

Quant (QNT)Price Prediction- May 9
Quant (QNT) is currently trading at $96.94, marking a decrease of 1% in the last 24 hours. The coin’s market cap stands at $1,408,685,726, with a circulating supply of 14,544,176 and a max supply of 14,612,493.
Additionally, the 24-hour trading volume is at $19,831,701, indicating active trading interest in the token. Over time, QNT’s price has closed above its opening level on 48.23% of days.
The all-time high for a QNT coin was $380.72, reached two years and seven months ago, which is a 74.54% drop from the current price. Historically, October has been the best month for Quant in the past seven years, while November has been the worst.
QNT/USD Long-term Trend: Bearish (Daily Chart)
Key levels:
Resistance Levels: $100, $105, $110
Support Levels: $95.00, $90.00, $85.00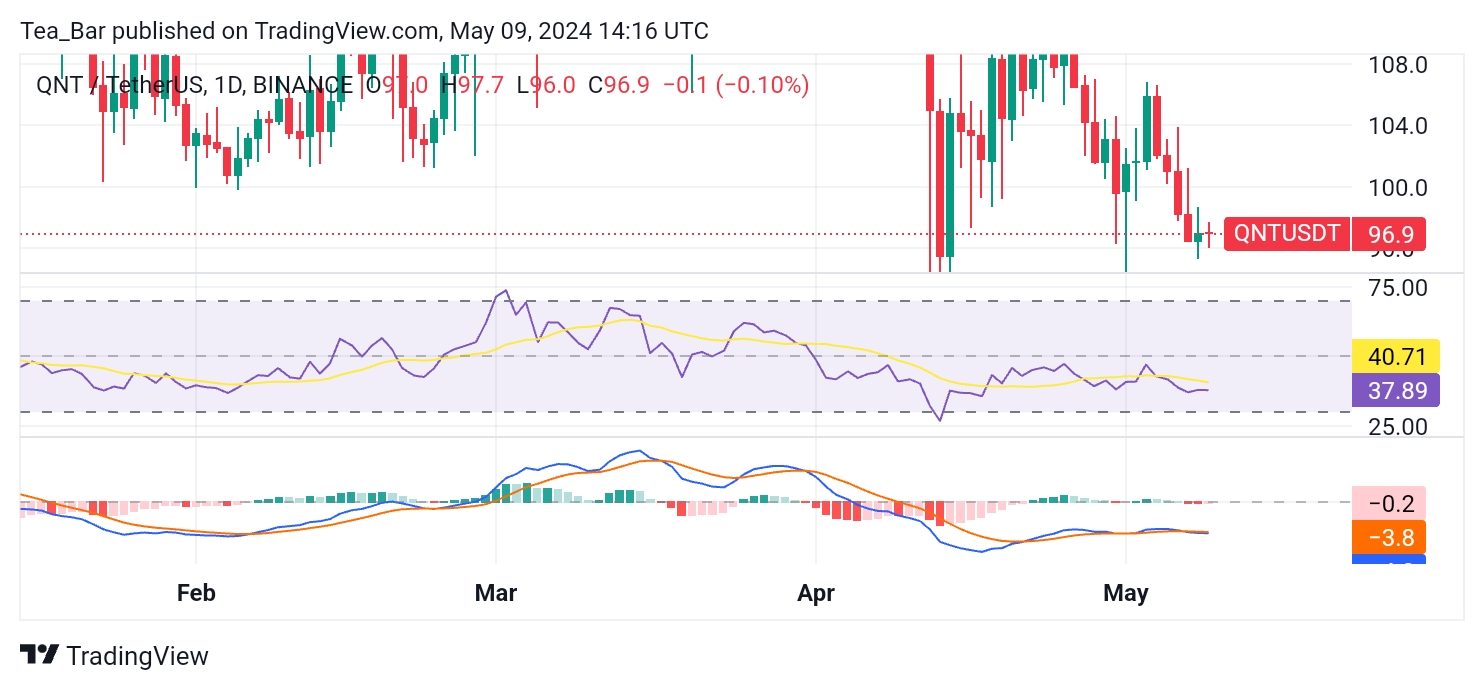
On the daily chart, the Relative Strength Index (RSI) stands at 37.89 which suggests that the market is approaching an oversold condition. Meanwhile the MACD indicator is below the zero line (-3.8), indicating a bearish trend.
The initial support is located around $95.00, which is a key psychological level. If the price breaks below this point, further support can be found around $90.00.
Also, the immediate resistance is seen at $100.00, a significant psychological level. A successful break above this level could see the price test the next resistance at $105.00.
QNTUSD Medium-term Trend: Bearish (4H chart)
During this trading period, the technical indicators suggest potential changes in QNT’s trend. The Relative Strength Index (RSI) stands at 41.33. This shows a near-neutral stance with room for potential improvement. 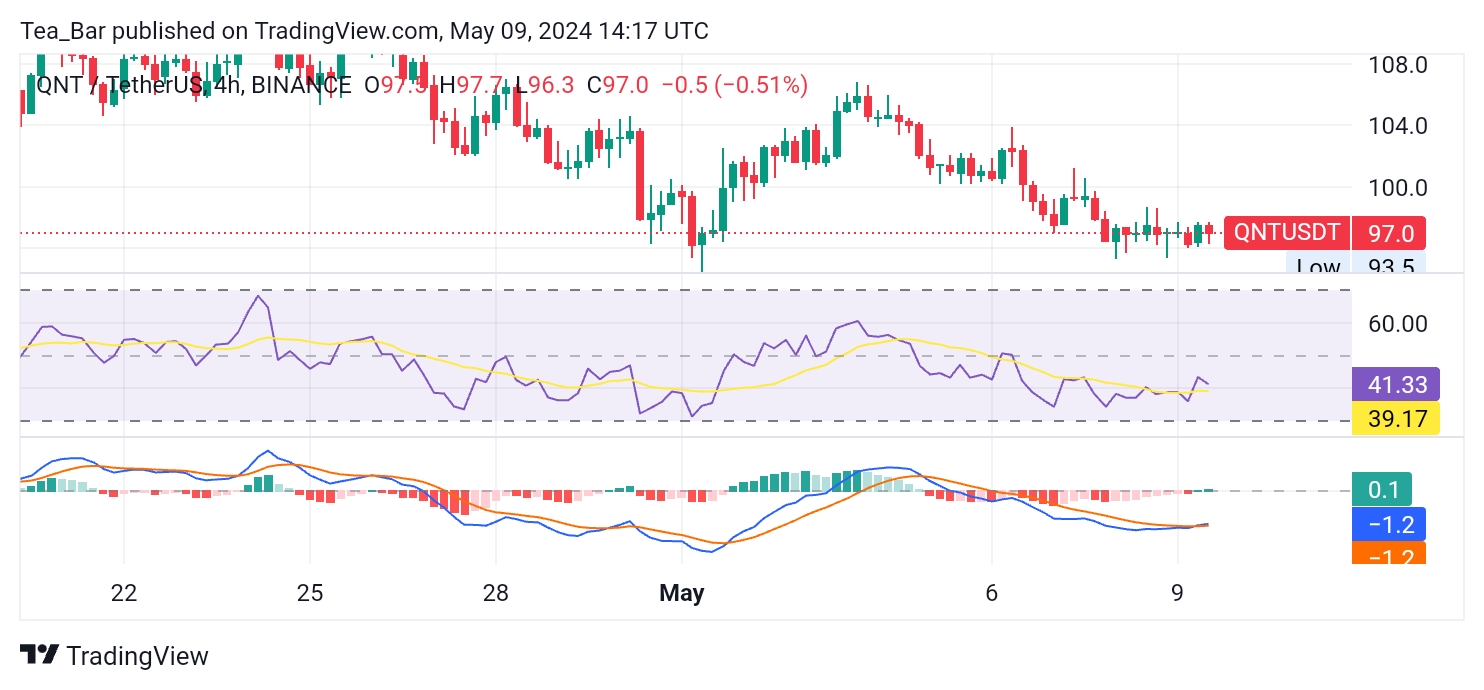
The Moving Average Convergence/Divergence (MACD) is below the zero line (-1.2) but displays traces of green histograms, suggesting the beginning of a potential bullish shift.
Conclusion
Quant (QNT) has faced recent downward pressure, but the technical indicators suggest a potential positive shift in the near term. Traders should watch key support and resistance levels at $95.00 and $100.00, respectively, as these could guide the next price movements.
The potential reversal and signs of bullish momentum on the 4-hour chart provide hope for QNT to move towards a stronger recovery. Traders should stay vigilant for changes in the trend and look for opportunities as the market potentially stabilizes.
Place winning Quant trades with us. Get QNT here.