Ripple Consolidates above $0.40 as It Risks Further Decline to $0.33
Estimated Reading Time: 2 minutes
Don’t invest unless you’re prepared to lose all the money you invest. This is a high-risk investment and you are unlikely to be protected if something goes wrong. Take 2 minutes to learn more


Free Crypto Signals Channel
Ripple (XRP) Long-Term Analysis: Bearish
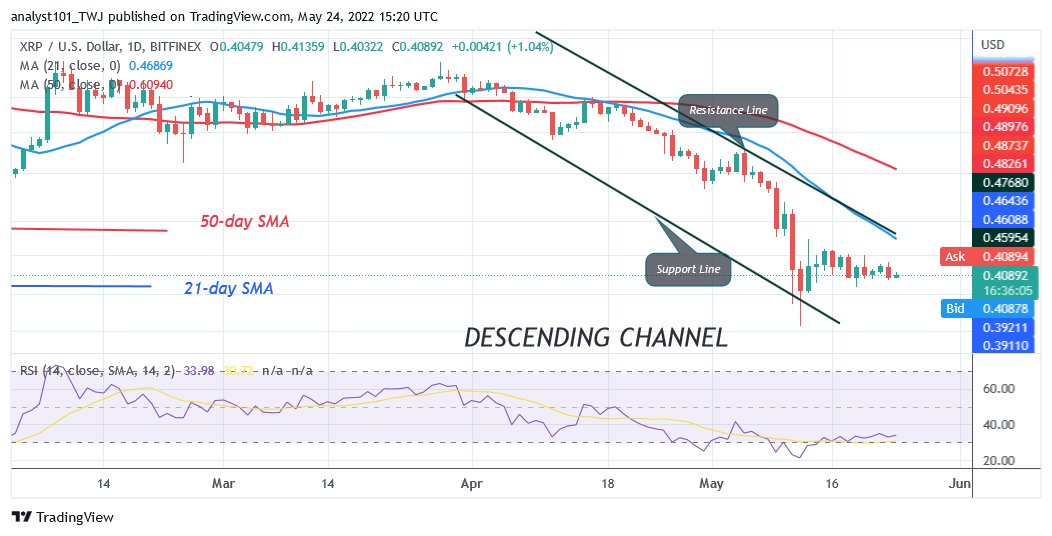
Ripple’s (XRP) price is in a sideways move as the altcoin risks further decline to $0.33 .On May 13, the bulls attempted to push XRP to the previous highs but were repelled. XRP has retraced above $0.40 support after the rejection. For the past week, XRP has been compelled to resume a sideways move. The altcoin has been fluctuating between $0.40 and $0.46 price levels. On the downside, the bulls have been defending the current support after pulling back from the low of $0.33. However, if the bears break below the $0.40 support, XRP will fall and revisit the $0.33 low. Similarly, if XRP rebounds above the $0.40 support, XRP will rally above the $0.46 resistance. The bullish momentum will extend to the previous highs.
Ripple (XRP) Indicator Analysis
Ripple is at level 33 of the Relative Strength Index for period 14. XRP is still in the downtrend zone as it consolidates above the $0.40 support. The downtrend will be over if price breaks above the moving averages. XRP is above the 35% range of the daily stochastic. The market is in a bullish momentum.
Technical indicators:
Major Resistance Levels – $2.00, $2.50, $3.00
Major Support Levels – $1.50, $1.00, $0.50
What Is the Next Direction for Ripple (XRP)?
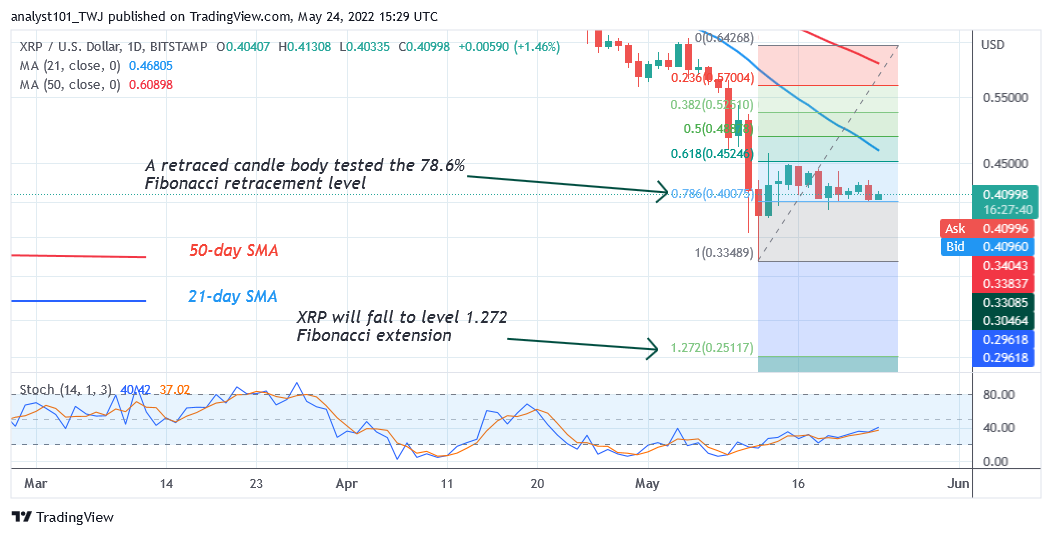
Ripple is in a sideways move but risks further decline to $0.33 . On the other hand, the uptrend will resume if the resistance at $0.46 is breached. Meanwhile, on May 12 downtrend; a retraced candle body tested the 78.6% Fibonacci retracement level. The retracement indicates that XRP will fall to level 1.272 Fibonacci extension or $0.25.
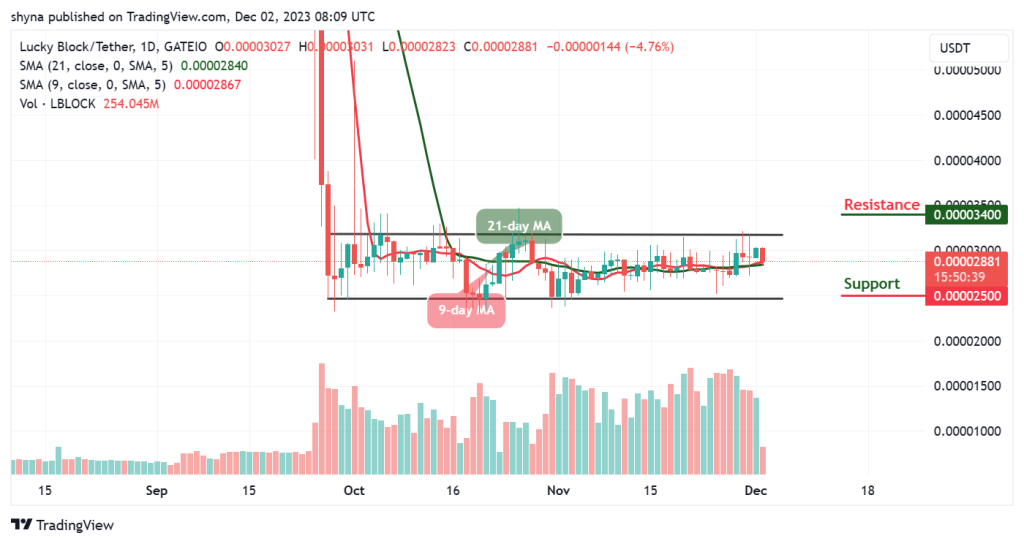
You can purchase crypto coins here. Buy LBlock
Note: Cryptosignals.org is not a financial advisor. Do your research before investing your funds in any financial asset or presented product or event. We are not responsible for your investing results