Ripple Corrects Upward as It Encounters Resistance at $0.50
Estimated Reading Time: 2 minutes
Don’t invest unless you’re prepared to lose all the money you invest. This is a high-risk investment and you are unlikely to be protected if something goes wrong. Take 2 minutes to learn more
Ripple (XRP) Long-Term Analysis: Bearish
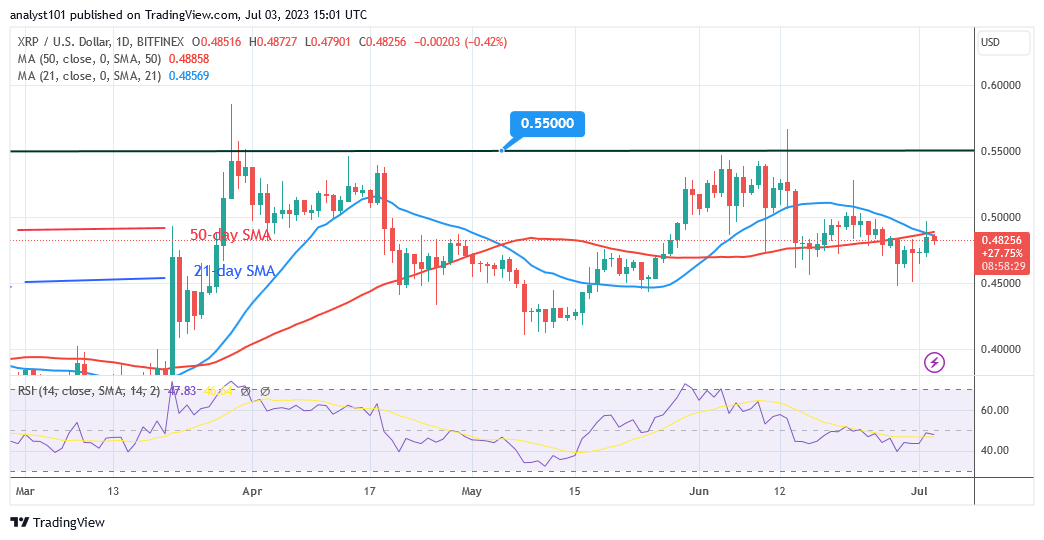
Ripple (XRP) price has fallen below the moving average lines as it encounters resistance at $0.50. The coin fell after being rejected by the $0.50 high. After retesting the recent high, selling pressure has resumed.XRP is trading between $0.44 and $0.50 during its initial fall. If the bears breach the $0.44 support, the selling pressure will intensify.
For example, if the bears breach the $0.44 support, the market would fall to the $0.41 support level. If, on the other hand, the present support level of $0.44 holds, XRP will be forced to trade in a range between $0.44 and $0.55.
Technical Indicators
Major Resistance Levels – $1.00, $1.50, $2.00
Major Support Levels – $0.50, $0.30, $0.10
Ripple (XRP) Indicator Analysis
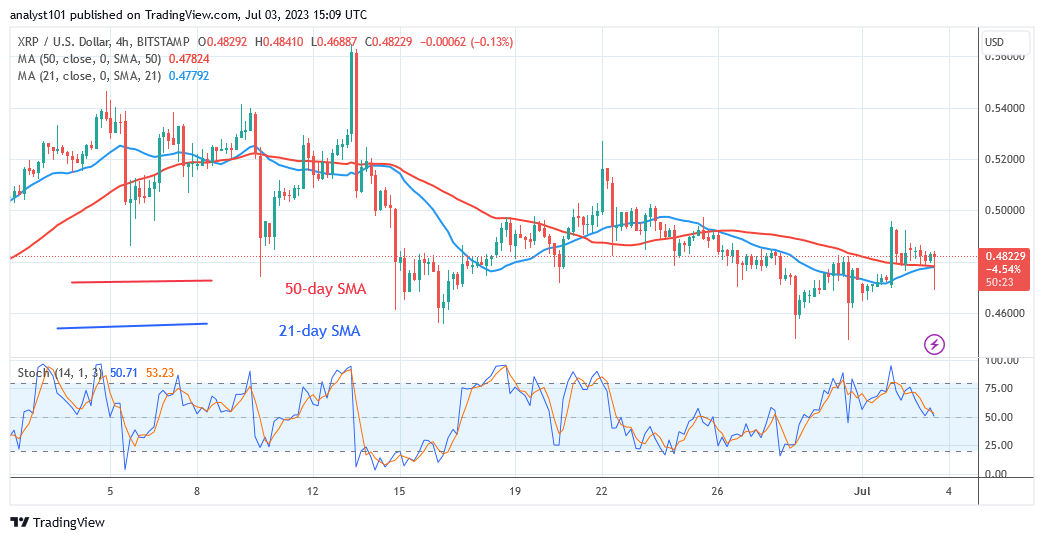
XRP is at level 48 of the Relative Strength Index for period 14. The coin is correcting higher as it retests the recent high. The price bars have fallen below the moving average lines, indicating that the cryptocurrency will continue to plummet. The bearish momentum has slowed to less than 60 on the daily Stochastic.
What Is the Next Direction for Ripple (XRP)?
Ripple is trading above the $0.44 support level as it encounters resistance at $0.50. In the meanwhile, the altcoin is trading in a narrow band of $0.44 to $0.50. When the present resistance and support levels are breached, XRP will either fall or increase. The altcoin is currently being repelled by the moving average lines.
You can purchase crypto coins here. Buy LBLOCK
Note: Cryptosignals.org is not a financial advisor. Do your research before investing your funds in any financial asset or presented product or event. We are not responsible for your investing results