Ripple Remains above $0.33 as It Continues to Consolidate
Estimated Reading Time: 4 minutes
Don’t invest unless you’re prepared to lose all the money you invest. This is a high-risk investment and you are unlikely to be protected if something goes wrong. Take 2 minutes to learn more
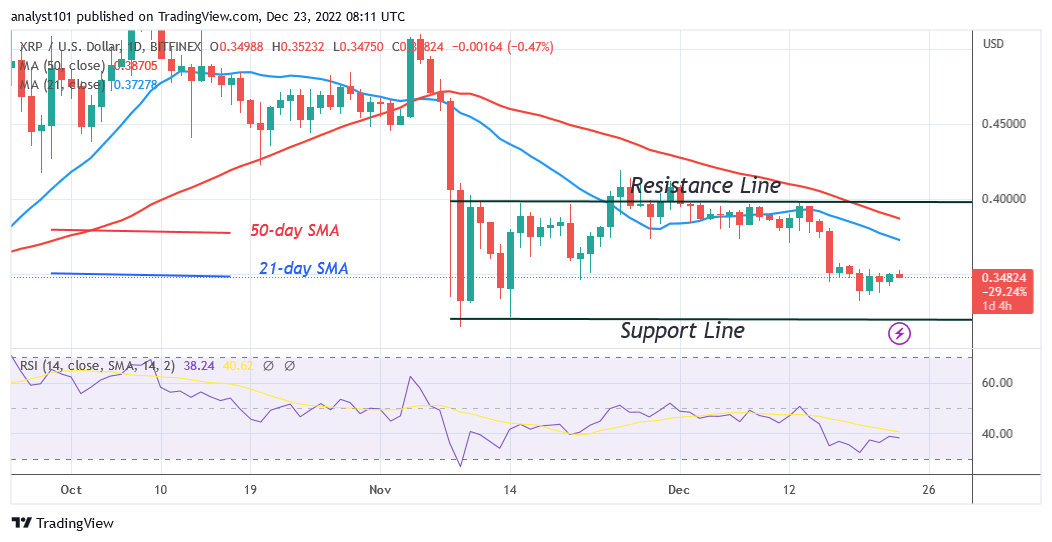
Ripple (XRP) Long-Term Analysis: Bearish
Ripple’s (XRP) price is remaining above $0.33 as it continues to consolidate. The cryptocurrency asset had only risen to a high of $0.34 at the time of writing, from a low of $0.33. Doji candlesticks, small-body indecisive candlesticks that signify price stagnation, have been present for the past five days. The candlesticks show that buyers and sellers are divided over the market’s course. Right now, the price of XRP fluctuates between $0.32 and $0.40. The altcoin will cross over the moving average lines if XRP recovers. Perhaps the $0.40 resistance will be overcome by the bullish momentum. This will help XRP reach its previous highs once more. On the downside, further decline is unlikely given that the market is getting close to being oversold.
Ripple (XRP) Indicator Analysis
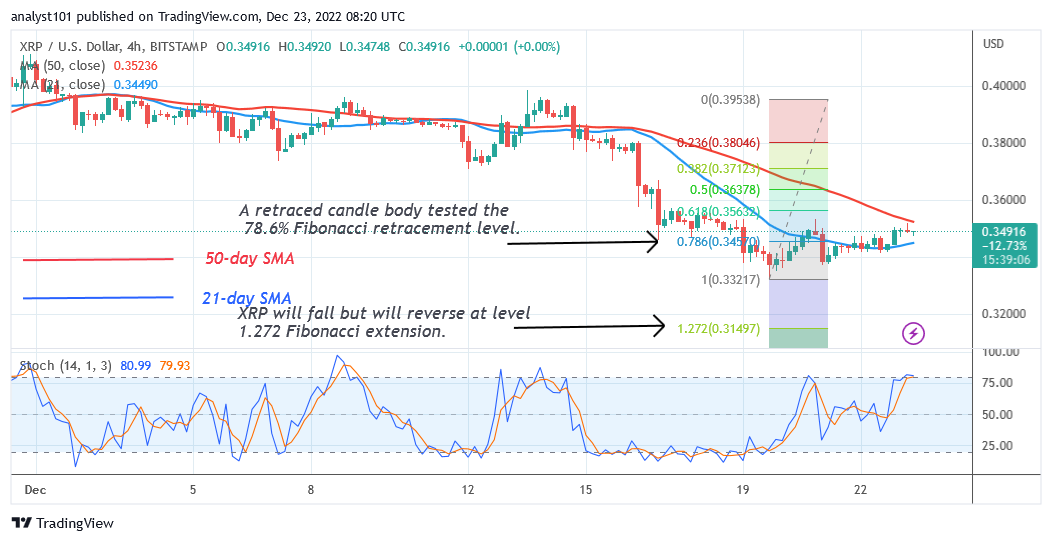
For period 14, Ripple has maintained its 38 Relative Strength Index level. As the market entered oversold territory, the bearish trend started to wane. The price will keep falling because the price bars are currently below the moving average lines. XRP is currently trading above the daily Stochastic level of 80 on the 4-hour chart. This suggests that the market has overbought at this point. As sellers appear in the oversold area, XRP may decline.
Technical indicators:
Major Resistance Levels – $2.00, $2.50, $3.00
Major Support Levels – $1.50, $1.00, $0.50
What Is the Next Direction for Ripple (XRP)?
On the 4-hour chart, XRP is encountering resistance as it remains above $0.33 and continues to consolidate. the $0.35 high. Sellers are attempting to break below the moving average lines. The downside could experience more selling pressure. On December 19’s downward trend, XRP made an upward correction, and a candle body tested the 78.6% Fibonacci retracement level. The correction predicts that XRP will decline until the 1.272 Fibonacci extension level, or $0.31, at which point it will turn around.
You can purchase crypto coins here. Buy LBLOCK
Note: Cryptosignals.org is not a financial advisor. Do your research before investing your funds in any financial asset or presented product or event. We are not responsible for your investing results