Ripple (XRP) Consolidates Above the $1.00 Support, May Decline to $0.94 Low
Estimated Reading Time: 2 minutes
Don’t invest unless you’re prepared to lose all the money you invest. This is a high-risk investment and you are unlikely to be protected if something goes wrong. Take 2 minutes to learn more

Ripple (XRP) Long-Term Analysis: Bearish
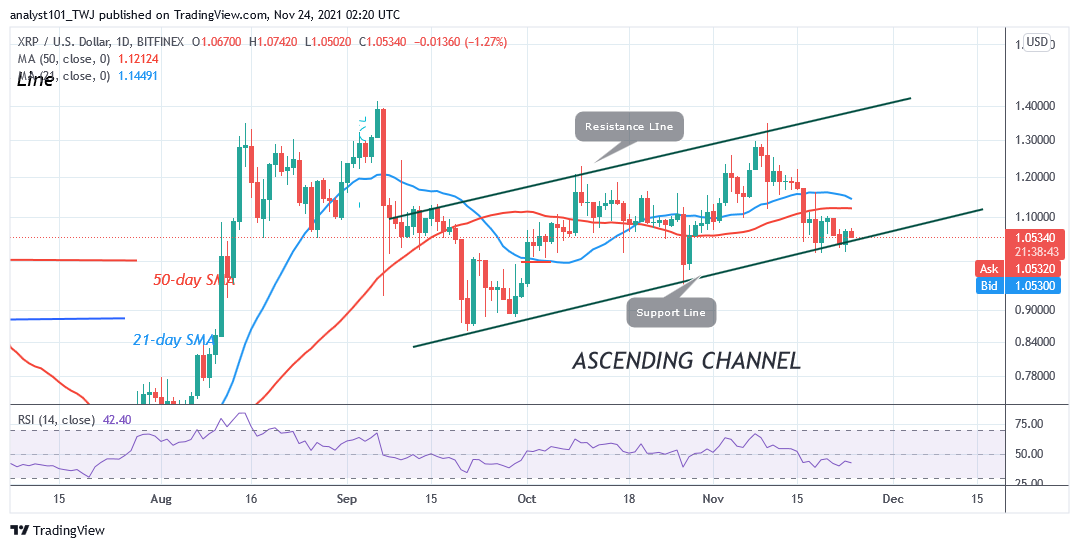
Since November 9, Ripple’s (XRP) price has been in a downward move. The altcoin fell to the low of $1.01 and resumed consolidation above it. For the past week, the current support has been holding. Today, the altcoin is rising on the upside but will face resistance at the high of $1.10. On the upside, if price breaks above the moving averages, the altcoin will resume upside momentum. Similarly, if price breaks below the current support, the cryptocurrency will decline to $0.94.
Ripple (XRP) Indicator Analysis
The crypto’s price bars are now below the 21-day line and 50-day line moving averages indicating a possible downward movement of prices. XRP has fallen to level 42 of the Relative Strength Index for period 14. The crypto is in the downtrend zone and below the centerline 50. Ripple is likely to further depreciate on the downside.
Technical indicators:
Major Resistance Levels – $2.00, $2.50, $3.00
Major Support Levels – $1.50, $1.00, $0.50
What Is the Next Direction for Ripple (XRP)
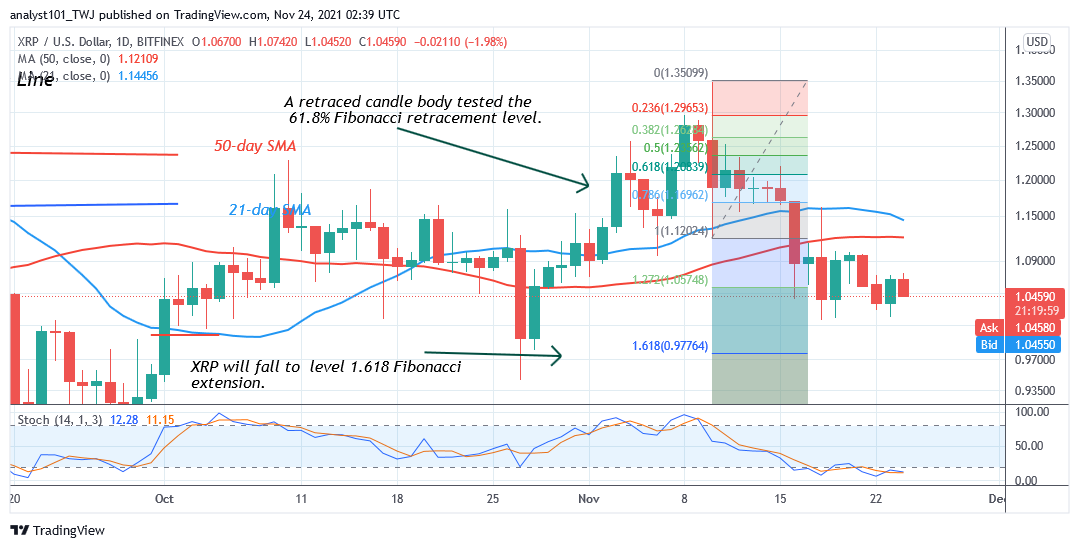
XRP/USD is in a downward move as price breaks below the moving averages. The crypto’s price has been stable above the $1.00 support Meanwhile, on November 10 downtrend; a retraced candle body tested the 61.8% Fibonacci retracement level. The retracement indicates that XRP price will fall to level 1.618 Fibonacci extensions or $0.97.
You can purchase crypto coins here. Buy Tokens
Note: Cryptosignals.org is not a financial advisor. Do your research before investing your funds in any financial asset or presented product or event. We are not responsible for your investing results