Head and Shoulders Spell South-side Rally for Solana Against the Bitcoin
Estimated Reading Time: 3 minutes
Don’t invest unless you’re prepared to lose all the money you invest. This is a high-risk investment and you are unlikely to be protected if something goes wrong. Take 2 minutes to learn more

Free Crypto Signals Channel
Solana’s recent high-paced performance in approaching $40 needs caution as a keen observer can see on the SOL/BTC Chart the likely formation of a head and shoulder pattern to form a much-needed high to continue the downward move.
Technical Analysis
SOL/USD Daily CHART
On the SOLUSD Daily Chart, one can see a rising trend indicated by the letters A-B-C-D-E-F peaking at $48.42. However, a sharp decline ensued breaking the last two lows indicating that the bulls are getting done.
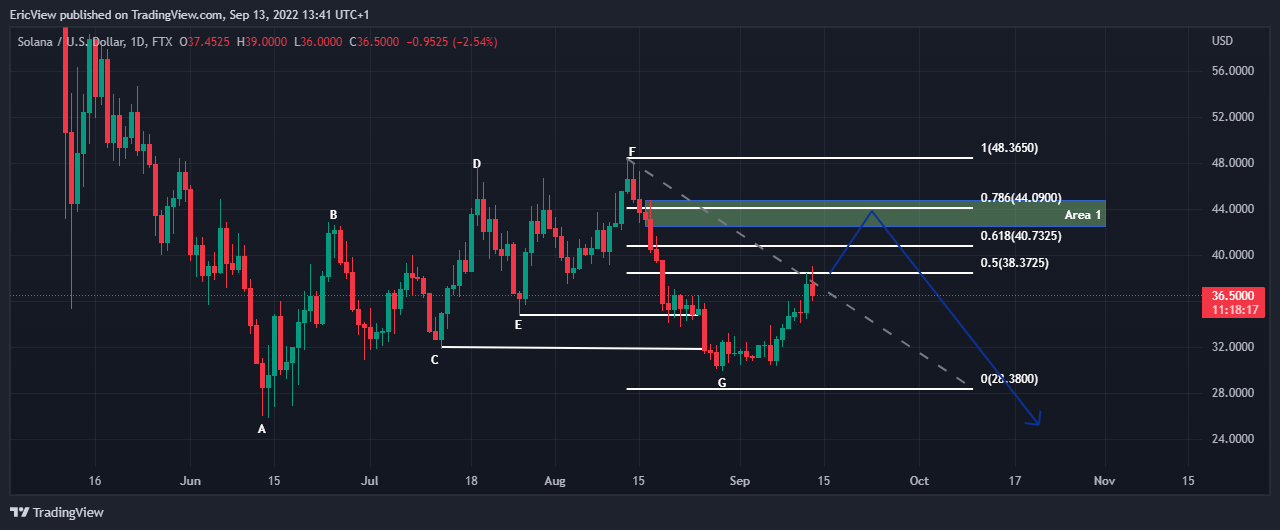
The market’s behaviour in that sharp relay downwards leaves inefficiencies, and areas of market gaps, that need to be filled for the market’s stability. The area denoted as Area 1 ($42.45-$44.75) is the market block responsible for the market gap. Interestingly, that same Area 1 happens to be in confluence with the Fibonacci Retracement high spot value of 78.6.
SOLUSD finding support at point G ($29.915) in the chart above has steadily climbed its way back and heading towards Area 1. Area 1 becomes a key area to observe for a possible entry of bears into the market.
SOL/BTC CHART
Additionally, the Daily SOL/BTC chart is not left out of this incoming south-side rally. The SOLBTC has been on a long-term downtrend from point A, with its recent attempt to the upside terminating at 0.0030618, indicated by “C” on the chart below.
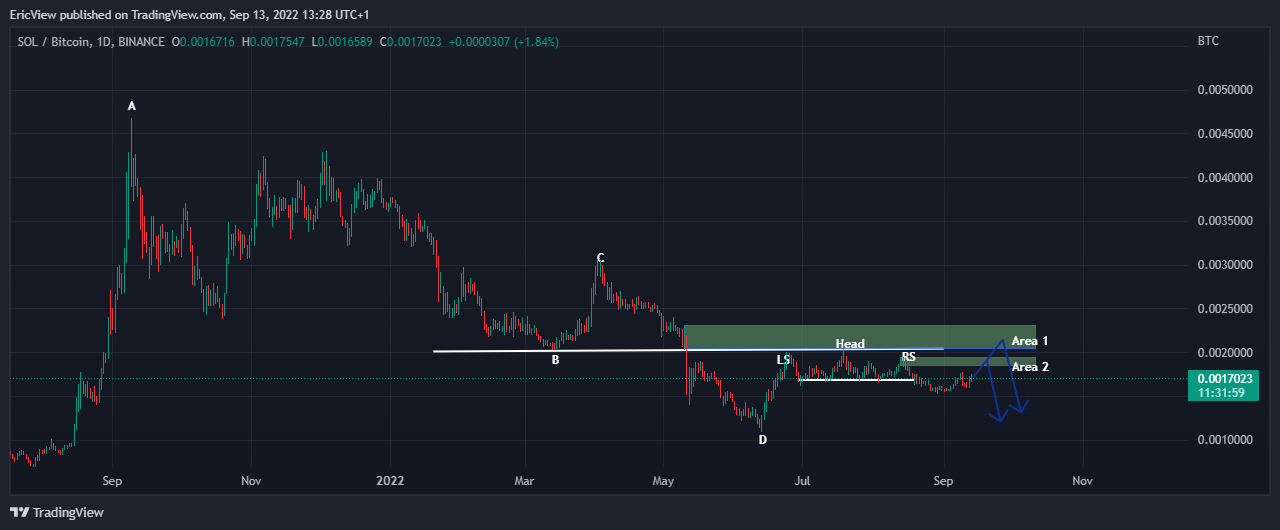
The price behaviour at point B was the last low and the support price had before the decline from point C set in at settled at point D. One will observe that the price pattern around the B area has shown a resistance offered by that area.
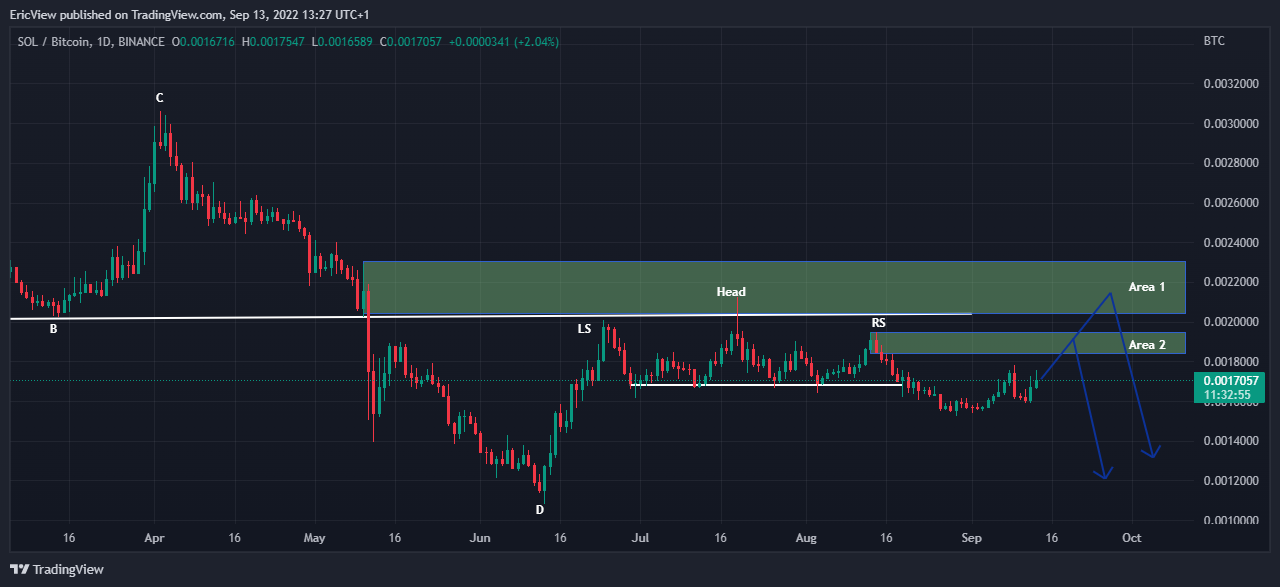
Furthermore, the bear motion from point C left market gaps at the same place where the market now has resistance, as evidenced by the bear pin bar that pierced through the area, Area 1 (0.00203850.0023054).
The price formation has shown a likely Head and Shoulder formation with the Right Shoulder (RS) potentially being an Area to wait on, Area 2 (0.0018371-0.0019480).
This Area 1 and Area 2 become areas to watch out for a south-side rally to continue.
You can purchase Lucky Block here. Buy LBLOCK