Arbitrum (ARB/USD) Gains Traction After Recovery From the Oversold Zone
Estimated Reading Time: 3 minutes
Don’t invest unless you’re prepared to lose all the money you invest. This is a high-risk investment and you are unlikely to be protected if something goes wrong. Take 2 minutes to learn more
The bear market of the previous weeks forced the Arbitrum market into its first all-time low at the $1.036 price level. The $1.1464 price level has been the main support level for the market since it started. This same price level was expected to be the last place of refuge for the bulls during the bearish rage. However, a slight venture beyond this key support level triggered bullish activities in the fifth and sixth 4-hour sessions of May 8, and since then the bullish trend has been gaining more momentum.
ARB/USD Price Statistics
- ARB/USD Price Now: $1.18
- ARB/USD Market Cap: $1,502,293,242
- ARB/USD Circulating Supply: 1,275,000,000
- ARB/USD Total Supply: 10,000,000,000
- ARB/USD CoinMarketCap Ranking: #36
Key Levels
- Resistance: $1.233, $1.317, and $1.411
- Support: $1.048, $0.985, and $0.815
Price Prediction for Arbitrum: The Indicators’ Point of View
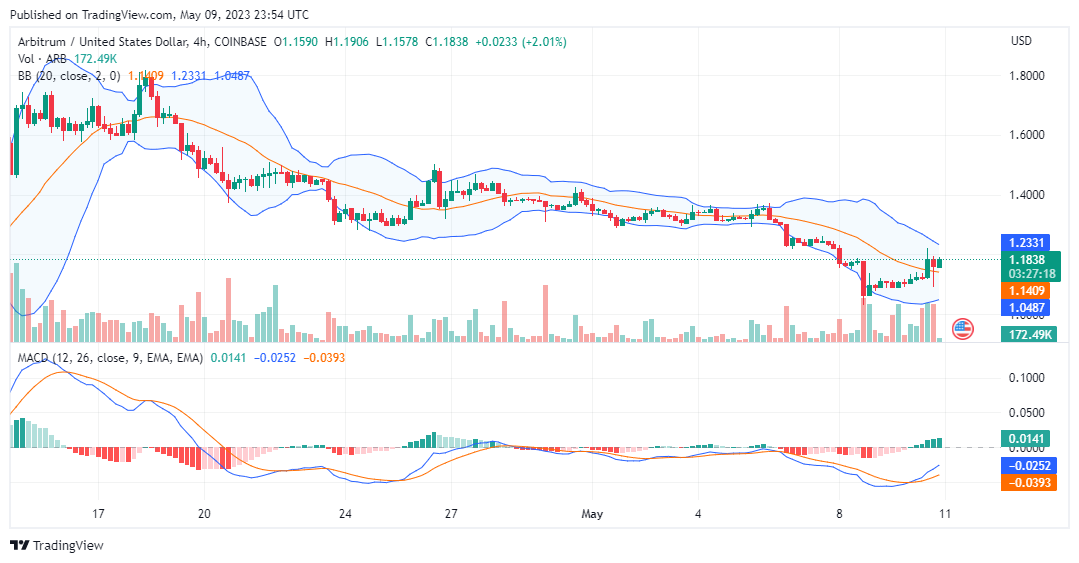
As Arbitrum market hit its first all-time low, many traders took this as an opportunity to buy the dip. Arbitrum has the prospect of a strong bullish performance, judging by its past performance. Although the bull market is gaining momentum as it goes, bears are still holding onto the $1.1811 price level. That price was formally a support level before it was captured by the bears, and now there is a formidable bearish sentiment around that price level. The Moving Average Convergence and Divergence (MACD) indicator is still bullish, but the two lines are still below level zero, ready to cross out of the bearish zone. The lines need to cross out of the bearish zone to confirm the bullish sentiment.
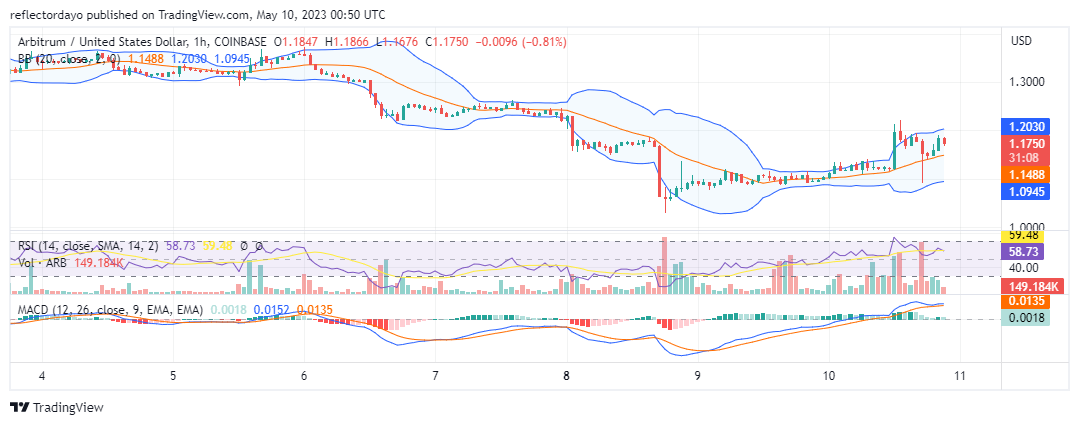
ARB/USD 1-Hour Chart Outlook: Bullish Recovery In Progress
Because the Arbitrum market is new with very limited historical data, we based this analysis on the 4-hour timeframe and the 1-hour timeframe. Looking at the market from the perspective of the 1-hour timeframe, we already have an up-trending market. The indicators used for this timeframe are bullish. According to the Bollinger Bands indicator, initially, the market was trending upward with low volatility. This shows that the market was at some point one-sided, but after the market hit the $1.1811 resistance price level, the volatility came alive because the bear market was triggered. Despite this, the market continues to trend upward.