Bancor (BNT/USD): The Bulls Are Aggressive, and the Price of the Market Is on the Rise
Estimated Reading Time: 3 minutes
Don’t invest unless you’re prepared to lose all the money you invest. This is a high-risk investment and you are unlikely to be protected if something goes wrong. Take 2 minutes to learn more
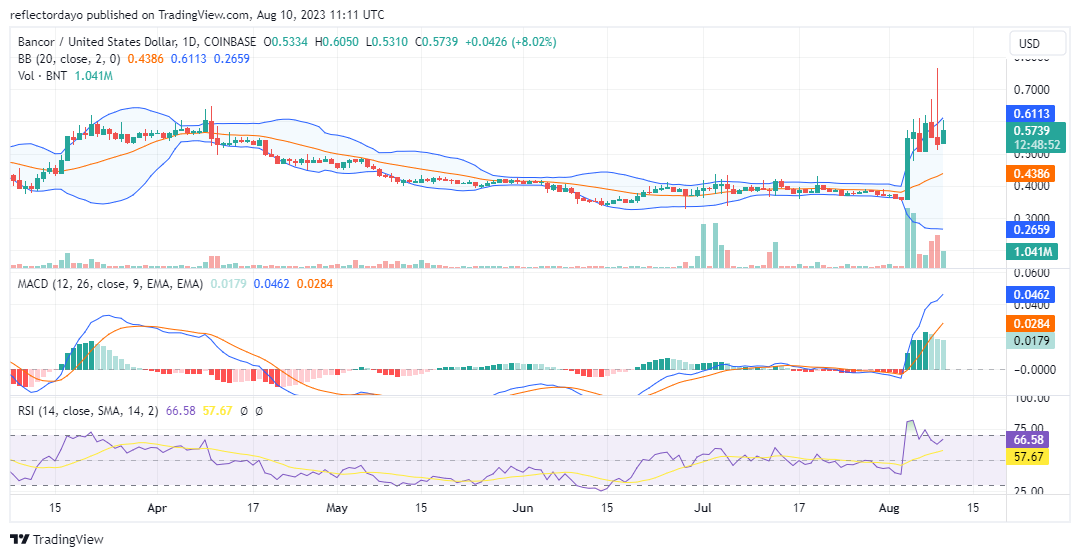
Since July 1, the Bancor market has been exhibiting a confined horizontal trading range. However, during the span from July 1 to 5, trading volume witnessed an uptick, signifying heightened interest. Despite this, discernible price movement remained absent. Subsequently, the market continued to conform to a consolidating trend for the remainder of the month.
A notable shift in market dynamics emerged on August 4. At this juncture, the market identified a support level at $0.357, indicating a potential shift in trader sentiment. This particular support level seemingly drew in buyers, potentially denoting a pivotal moment. Augmenting this shift, there was a notable surge in trading volume on the same day, underscoring escalated market activity.
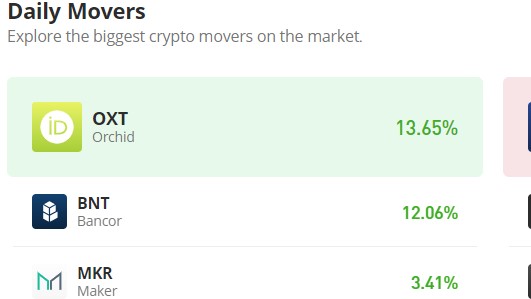
Bancor Market Data
- BNT/USD Price Now: $0.5738
- BNT/USD Market Cap: $84,048,198
- BNT/USD Circulating Supply: 146,477,940 BNT
- BNT/USD Total Supply: 161,196,921 BNT
- BNT/USD CoinMarketCap Ranking: #268
Key Levels
- Resistance: $0.65, $0.70, and $0.80.
- Support: $0.35, $0.30, and $0.25.
Price Prediction for Bancor: The Indicators’ Point of View
The Bancor market’s response to the support level at $0.357 was explosive, with a surge in trading volume propelling the BNT/USD pair into a higher price channel. This channel is defined by the $0.500 and $0.600 price levels. The breach of the $0.500 price level marked a significant bullish development, potentially attracting further buying interest.
The heightened volatility since August 4 is reflected in the behavior of the Bollinger Bands. The divergence of the Bollinger Bands suggests that the market is experiencing increased price fluctuations. This is consistent with the explosive move and subsequent oscillations within the newly established price channel. Heightened volatility often indicates uncertainty and can result in sharp price swings in either direction.
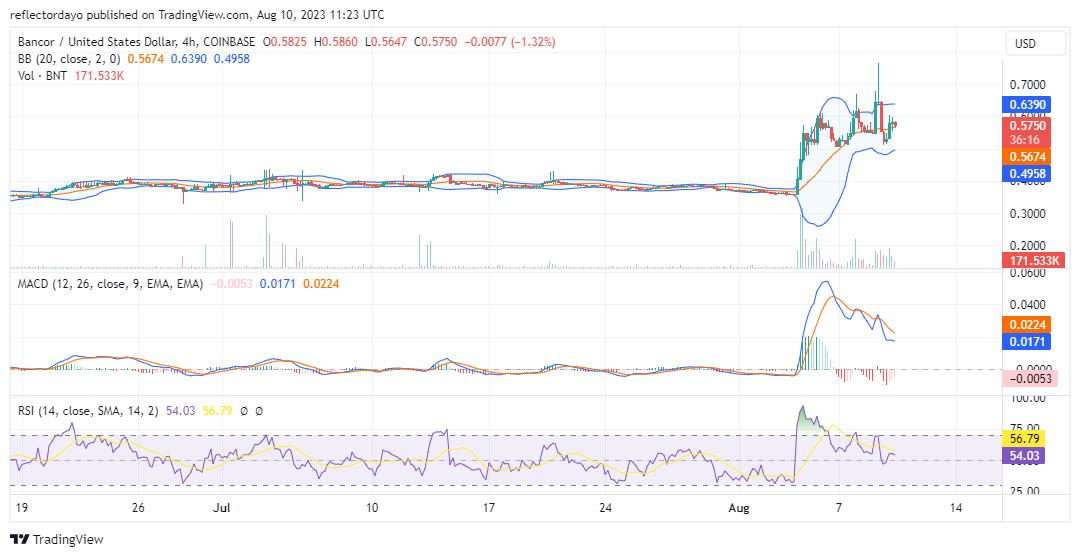
BNT/USD 4-Hour Chart Outlook
On a more compact timeframe, the range encompassed by the swing is transitioning towards the $0.700 price range. Given the current market conditions, traders and investors could be seeking potential resistance zones rooted in historical price patterns and psychological thresholds, such as the $0.80 or $1.00 levels. Notably, yesterday’s peak represents the highest point the market has reached this year, suggesting the possibility of resistance emerging around this particular level.