Bancor (BNTUSD) Faces the Bearish Stronghold at the $0.45 Price Level
Estimated Reading Time: 2 minutes
Don’t invest unless you’re prepared to lose all the money you invest. This is a high-risk investment and you are unlikely to be protected if something goes wrong. Take 2 minutes to learn more
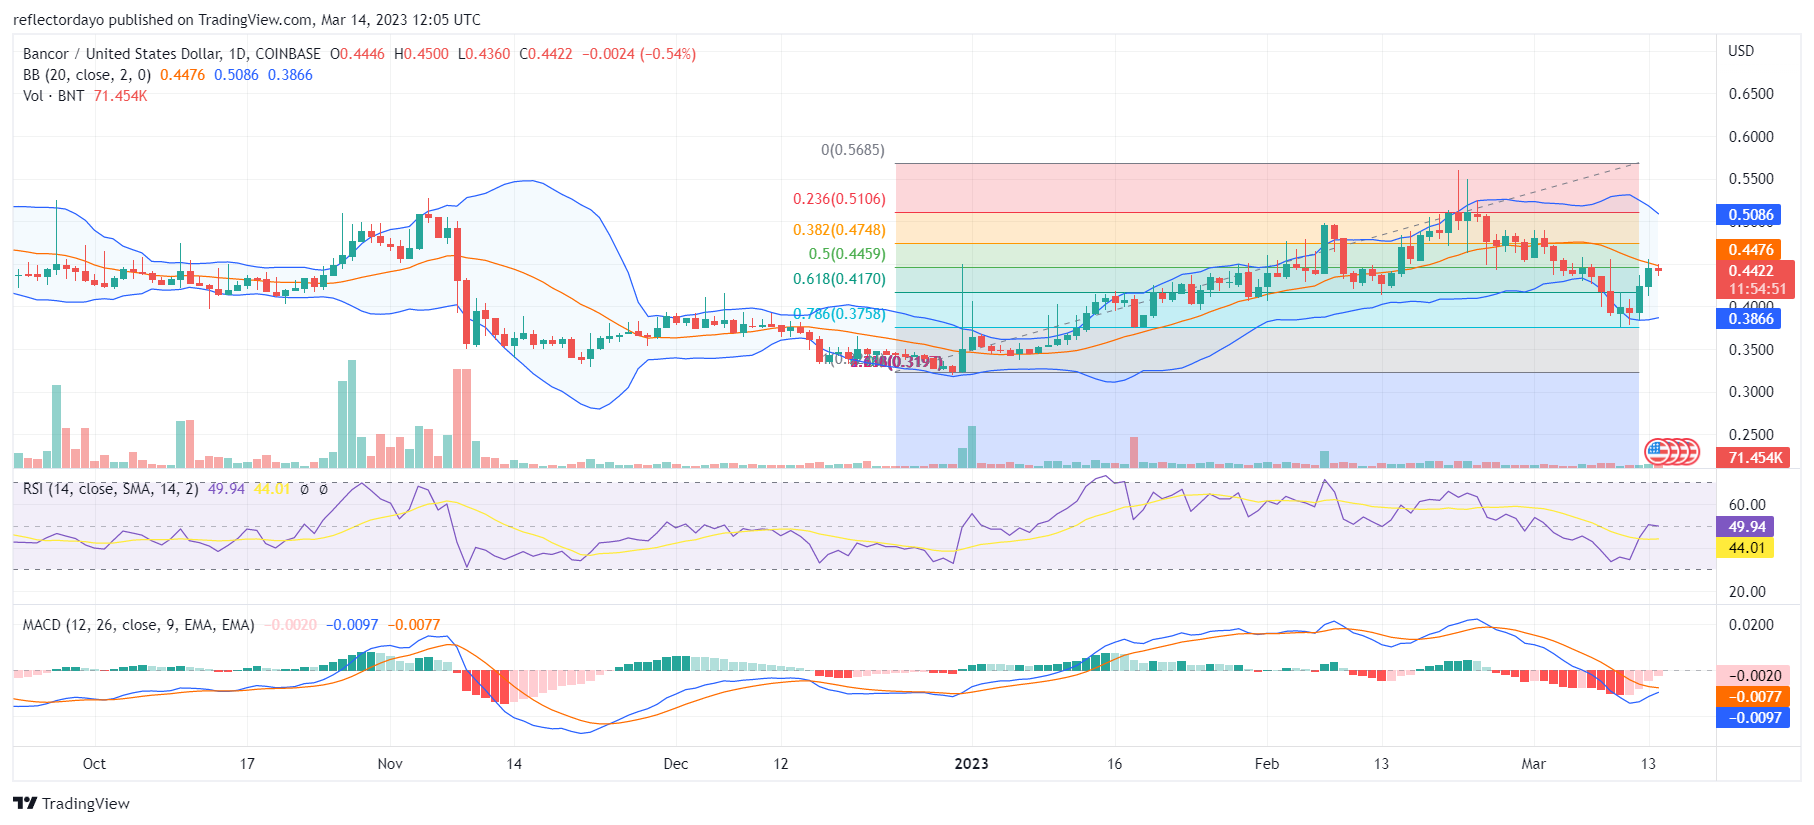
In the Bancor market, the $0.45 price level continues to be a stronghold for the bears. The market began to rise on January 1, but after reaching the $0.45 price level, it has since been hampered. The market spent half of February at this level as they could not break the resistance. However, the resilient BNTUSD buyers eventually wear out the bearish resistance, and it gives way to the bull market. After reaching the price level of $0.5, the bears took over and the price fell to the January 18 support level, which is $0.38. The bull market is bouncing from this price level. However, the $0.45 price level is again standing in the way; it’s a major hindrance to the bull market.
BNT/USD Price Statistics
- BNT/USD price now: $0.44
- BNT/USD market cap: $71,254,751
- BNT/USD circulating supply: 160,003,818 BNT
- BNT/USD total supply: 160,003,818
- BNT/USD Coin market cap rank: #327
Key Levels
- Resistance: $0.55, $0.60, and $0.65
- Support: $0.35, $0.30, and $0.25
Price Prediction Bancor: The Indicators’ Point of View
Activities by the bulls have brought the price to the equilibrium level, which is the $0.45 price level. There is a high probability that the market will go into consolidation at this level, even though, according to the Bollinger Bands indicator, the market is volatile. The low volume of trade may be a contributing factor to the volatility and rapid swings of the market’s price. The Moving Average Convergence and Divergence (MACD) indicator carries a bullish sentiment on the market, although the MACD indicator lines and histograms are still below the level of zero. They are about to cross up above the zero level.
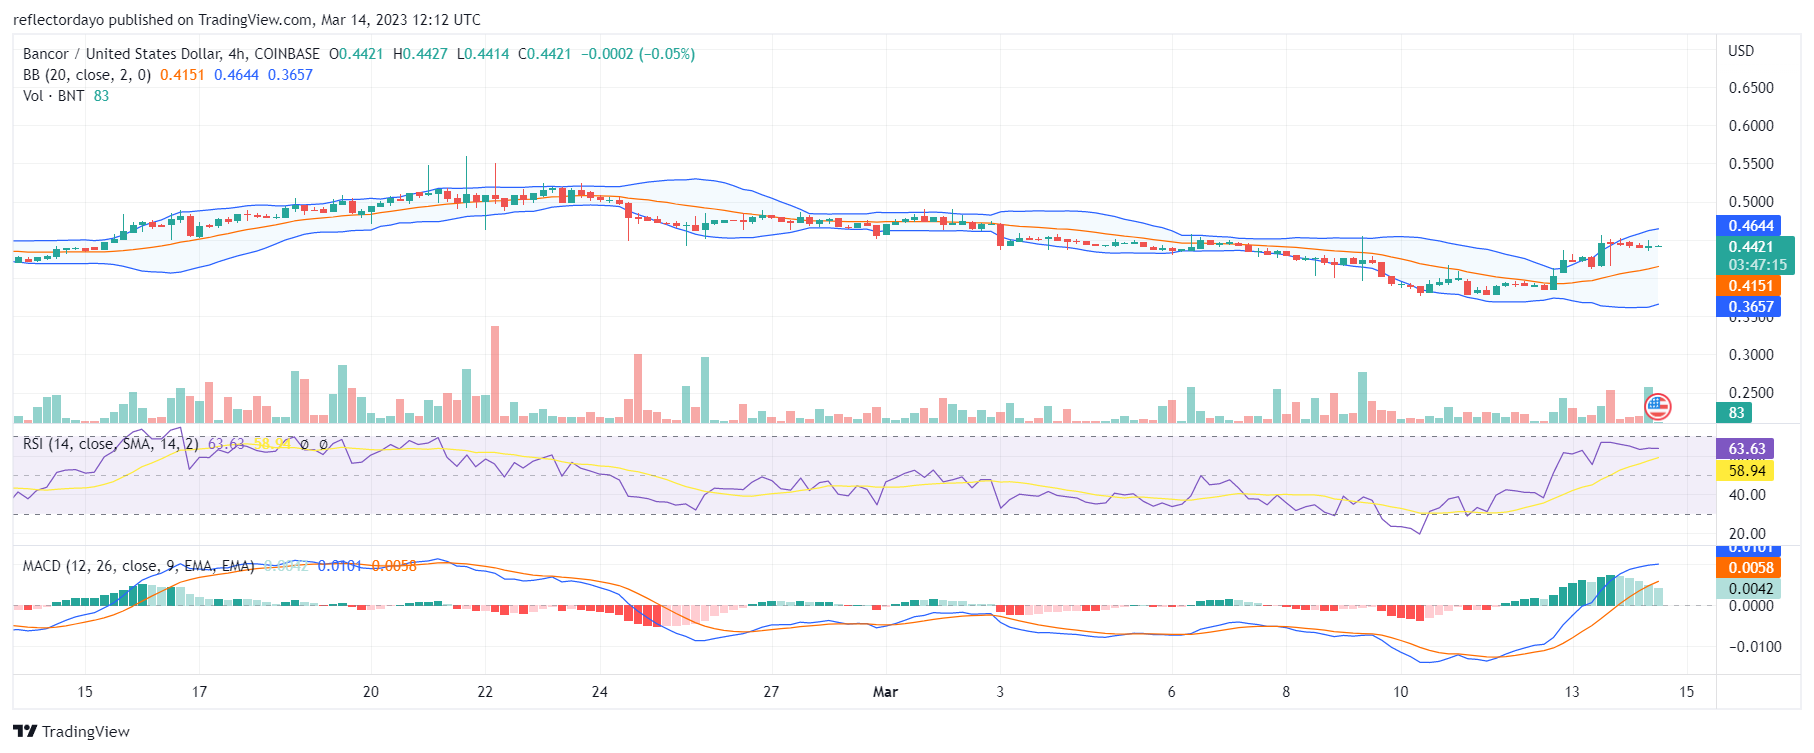
BNT/USD 4-Hour Chart Outlook
As the market approaches the key resistance level, we begin to see strong indications of indecision. We began to see Dojis representing the four-hour sessions yesterday. The market sessions for today so far have been completely flat. The Relative Strength Index (RSI) reflects this indecision trend, with the RSI line moving on a horizontal level. The market may settle into a consolidation trend before breaking out to the upside.