Band Protocol (BANDUSD) Reveals Signs of Breakout
Estimated Reading Time: 2 minutes
Don’t invest unless you’re prepared to lose all the money you invest. This is a high-risk investment and you are unlikely to be protected if something goes wrong. Take 2 minutes to learn more

Free Crypto Signals Channel
BANDUSD Analysis – Market Reveals Signs of Breakout
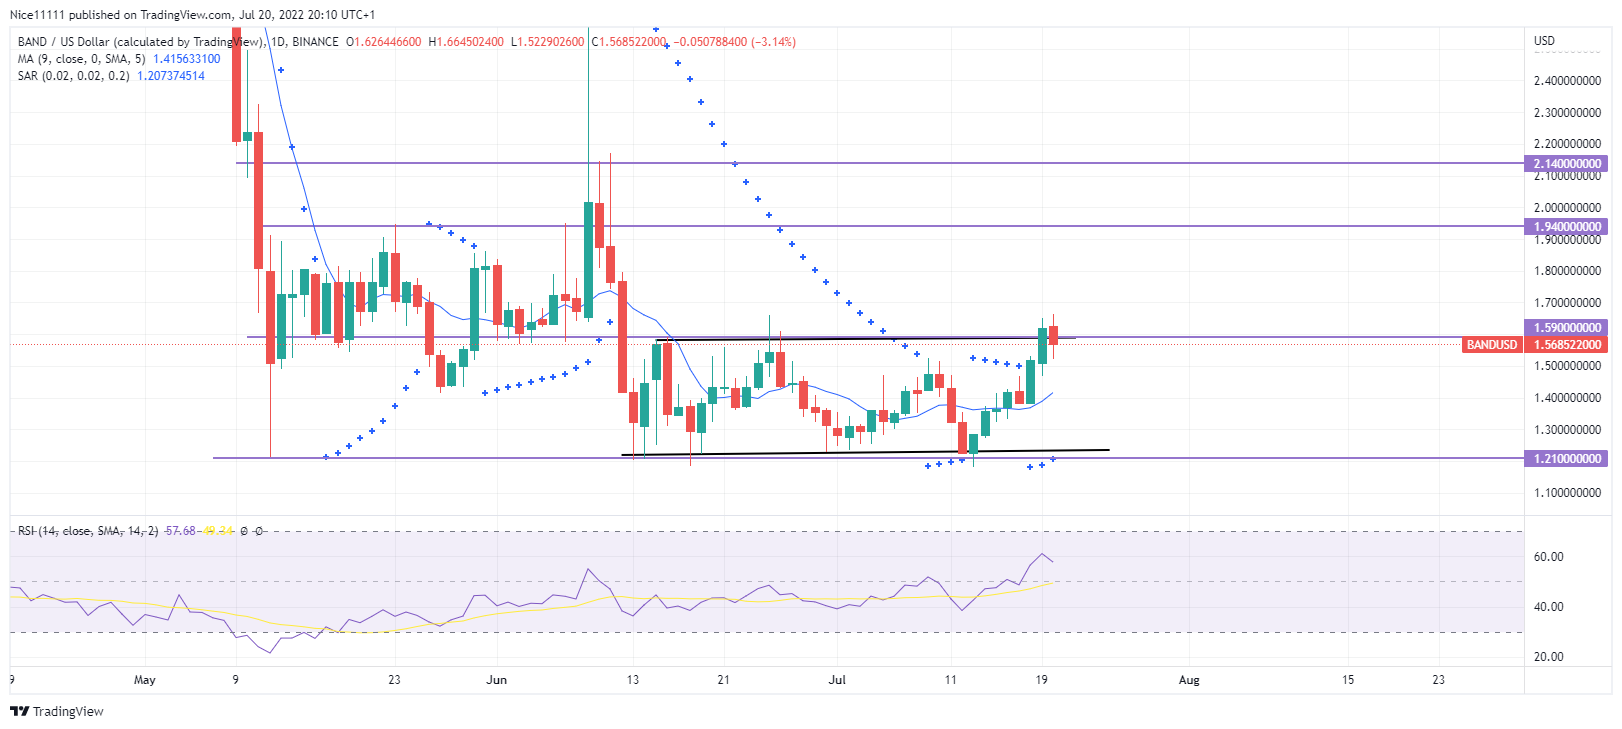
BANDUSD reveals signs of breakout on the higher time frame. The market has been trapped between key zones since the 13th of June. The bulls are showing signs of pulling through the range that has been formed.
BANDUSD Significant Zones
Demand Zones: $2.140, $1.940.
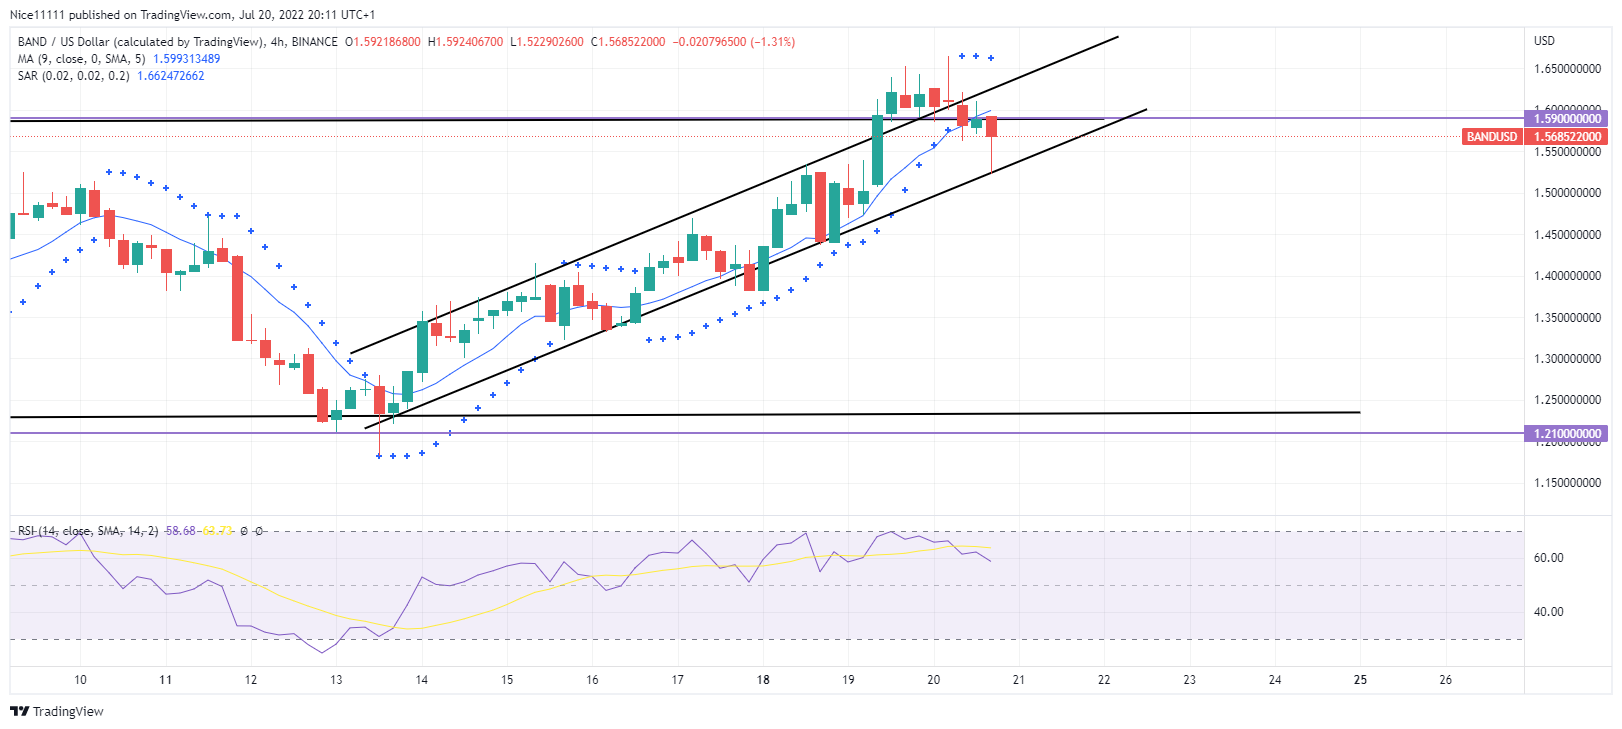
Supply Zones: $1.590, $1.210.
BANDUSD gyrated sideways between the $1.940 supply level and $1.590 demand level during the months of May and June. There was a bullish spike above $1.940, which was a directional manipulation to set traders long. A long shadow appeared above the bullish daily candle to show the rejection towards the upside. Three Black Crows were used to violate the consolidation. The fall of the daily candle below the Moving Average (period nine) was a clear sign of breakout. The market price fell below the range that had already been formed.
The market dropped below the demand level at $1.210. The support zone at $1.210 was well defended. This halted the bearish move. The previous support level of $1.590 has now become a resistance level. The market bounced back and forth between the previous support level at $1.590 and the lower support at $1.210. The Parabolic SAR (stop and reverse indicator) rested above the daily candles till the 12th of July. The Parabolic SAR is currently resting below the daily candles to signify bullishness. The Relative Strength Index also shows that the market is currently bullish, which is a positive sign of breakout on BANDUSD.
Market Expectation
On the four-hour chart, the market has broken the $1.590 key level. A bullish parallel channel has guided the candles to sweep the high of the range. The market is expected to rise to the next supply level at $1.940.
How To Buy Lucky Block
Note: Cryptosignals.org is not a financial advisor. Do your research before investing your funds in any financial asset or presented product or event. We are not responsible for your investing results.