Battle Infinity Market Forecast: IBAT Creates a Triple Bottom Formation to Break out of Consolidation
Estimated Reading Time: 3 minutes
Don’t invest unless you’re prepared to lose all the money you invest. This is a high-risk investment and you are unlikely to be protected if something goes wrong. Take 2 minutes to learn more
Battle Infinity Market Forecast: November 6
Battle Infinity market forecast is for the coin to spring off a weekly demand level and continue its upward rise.
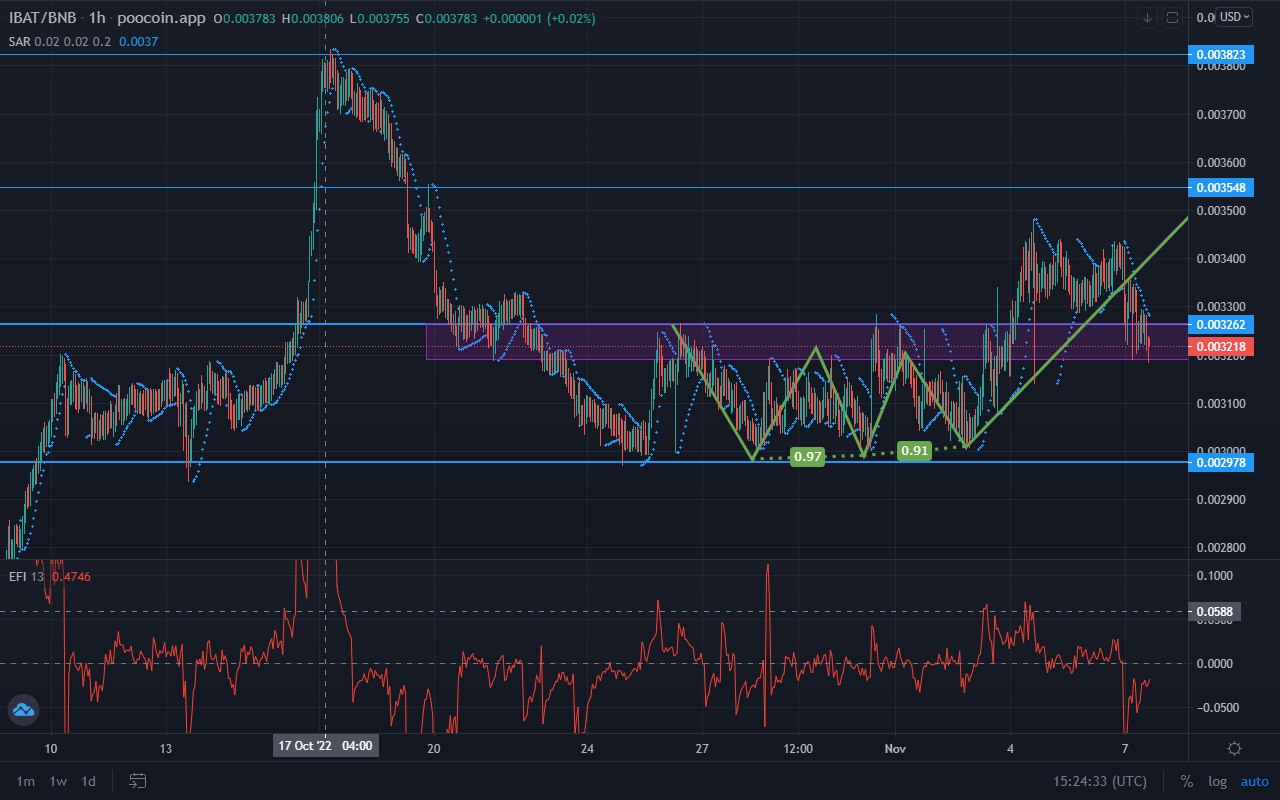
IBAT/USD Long-Term Trend: Bullish (1-Hour Chart)
Key Levels:
Supply Zones: $0.004025, $0.004667
Demand Zones: $0.003575, $0.00380
Towards the end of last month, the Battle Infinity market dropped back into a familiar range due to the weakness of the buyers in the market. This sets off a price accumulation process that lingers into this month. The presence of a strong supply level kept the coin in the ranging phase. This helps the price conform to the triple bottom pattern from which it breaks out.
Battle Infinity Market Forecast: IBAT/USD Outlook
The price returned to its former ranging zone on the 23rd of October. The return of the price aims to charge up the market and return it to its bullish activity.
During the ranging period, the coin hit the supply and demand levels three times each to give rise to a triple bottom market formation. This is a strong bullish structure that eventually sets the price free from range.
After the breakout, the price pulled back to retest the former resistance level. This sets the EFI (Elders Force Index) power line into a negative value, but the bulls are well placed to not lose grip on the market.
IBAT/USD Medium-Term Trend: Bullish (15-minute chart)
Despite plunging into a negative value on the 1-hour chart, the EFI power line has begun to recover upward. On the 15-minute chart, the power line has climbed back to equilibrium. This shows the buyers still have their grip on the market, and they intend to use the retracement to push the market further upward.
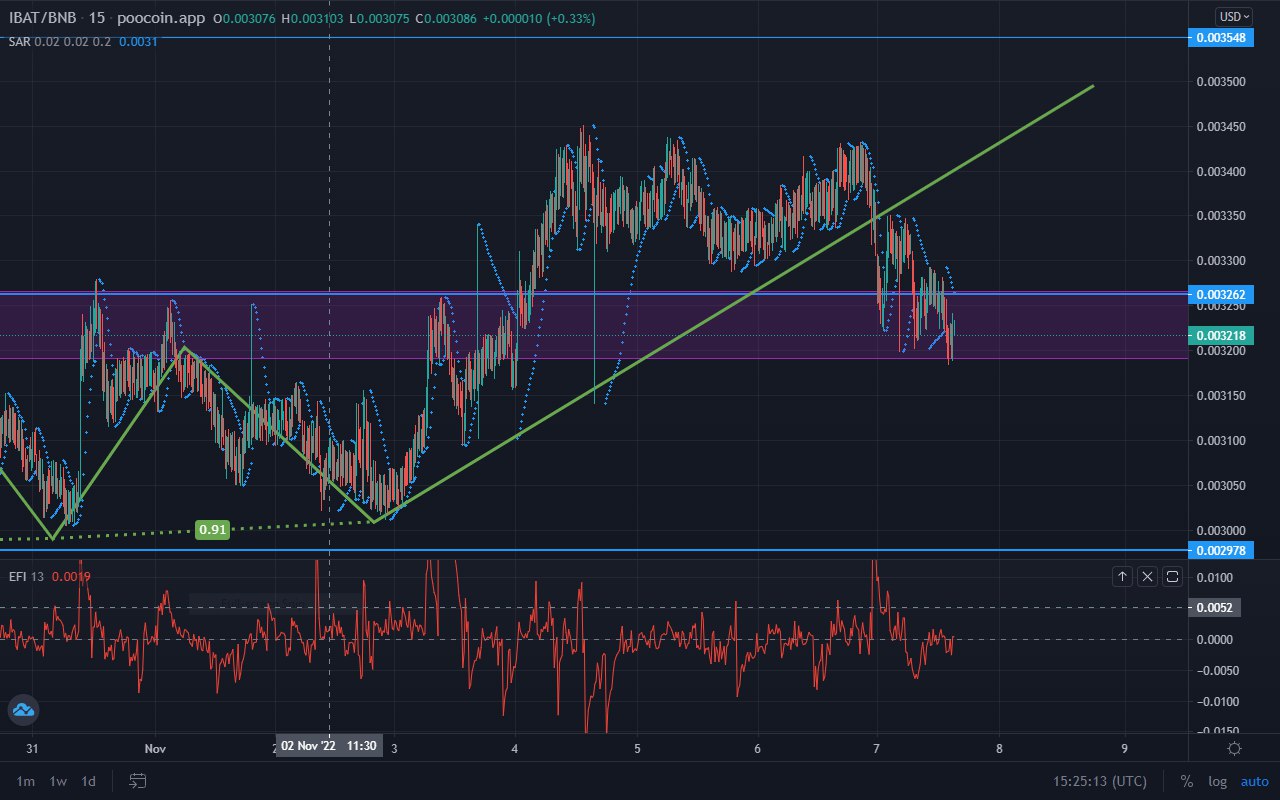
The Parabolic SAR (Stop and Reverse) indicator has dots around the candlesticks. The candles have begun to turn up on the 15-minute chart, and the appearance of the Parabolic SAR dots below the candles will all but confirm the rise of the price back upward to continue its bullish adventure.
Battle Infinity has huge potential for unusually massive returns. Buy IBAT
Note: Cryptosignals.org is not a financial advisor. Do your research before investing your funds in any financial asset or presented product or event. We are not responsible for your investing results.