Bitcoin (BTC) Price Prediction: BTC/USDT Eyes a New High
Estimated Reading Time: 2 minutes
Don’t invest unless you’re prepared to lose all the money you invest. This is a high-risk investment and you are unlikely to be protected if something goes wrong. Take 2 minutes to learn more

Date: June 11, 2025
Price activity in the Bitcoin daily market is resurging toward higher levels. Currently, it seems the market is targeting a new high. Considering the current state of price action, this appears quite possible. A more detailed analysis is provided below.
BTC/USDT Long-Term Trend: Bearish (Daily Chart)
Key Price Levels:
Resistance: $110,000, $112,000, $115,000
Support: $107,500, $105,000, $100,000
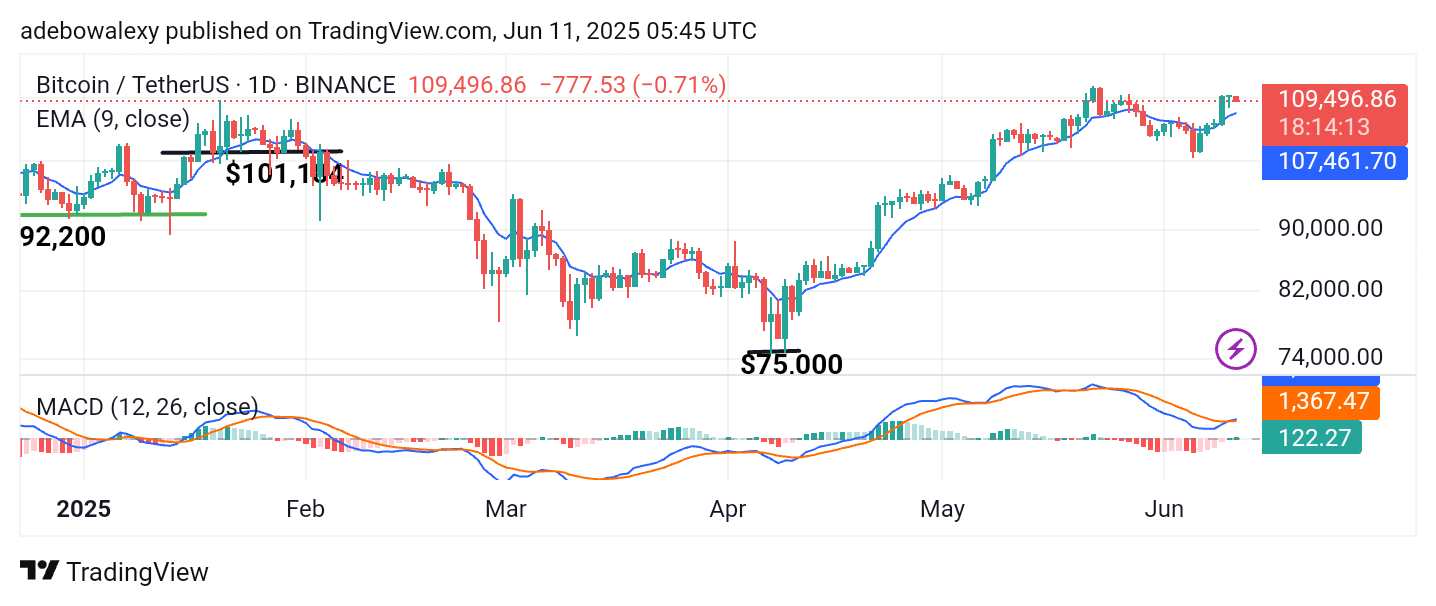
The price of Bitcoin recently hit the $110,000 level in the previous session. However, the ongoing session has experienced a modest downward retracement. Nevertheless, price activity remains above the 9-day Exponential Moving Average (EMA). Additionally, the Moving Average Convergence Divergence (MACD) lines have just delivered an upward crossover above the equilibrium level. Despite the retracement, the MACD indicator lines continue to trend upward without deflection.
Bitcoin (BTC) Price Prediction: BTC/USDT Stays Poised for More Climbs
Indeed, the Bitcoin market still occupies a favorable base level. The most recent daily candle is red but indicates only a minimal pullback. Price action saw a significant increase over the past two sessions, allowing it to remain above the 9-day EMA.
Similarly, the MACD lines are positioned above the equilibrium level following an earlier bullish crossover. The ongoing upward trajectory of the indicator lines suggests that price action is likely to continue rising.
Bitcoin (BTC) Price Prediction: BTC/USDT Appears to Be Eyeing the $115,000 Mark
On the 4-hour chart, Bitcoin’s price action has maintained a consistent bullish stance, staying above the 9-day EMA. While there has been a retracement for the second consecutive session, the downward momentum appears to be fading, as indicated by the size of the most recent candle compared to the previous one.
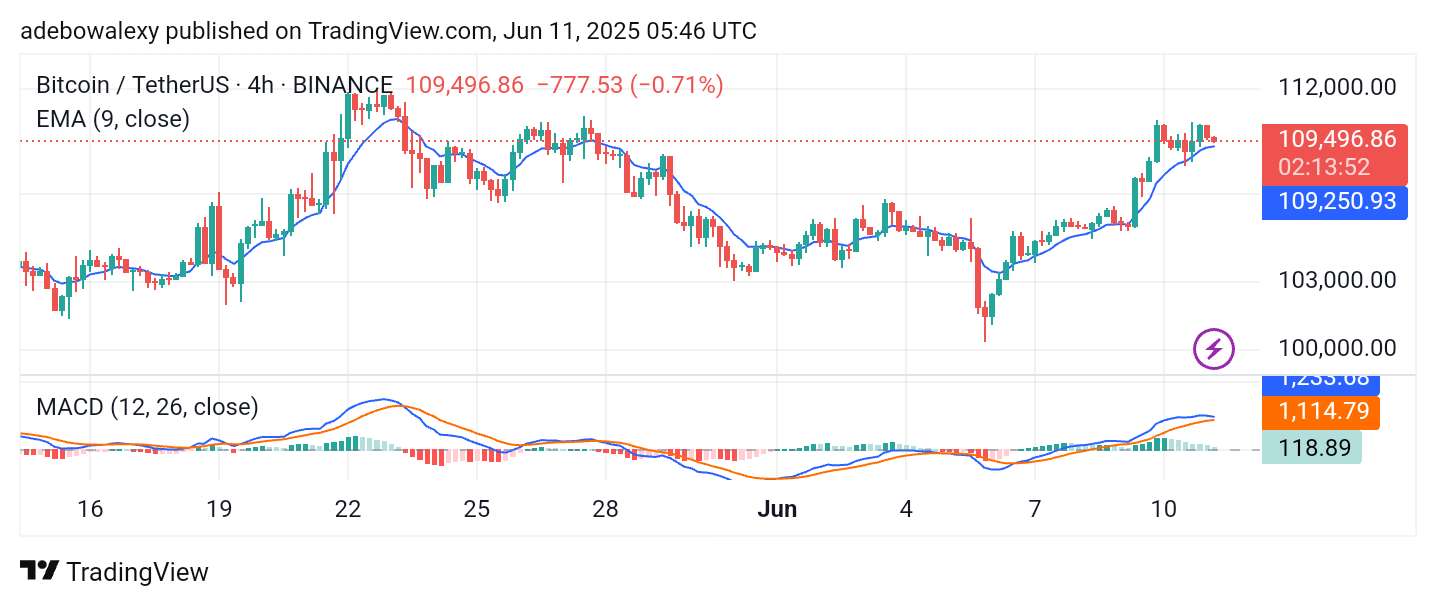
This retracement, occurring above the 9-day EMA, suggests a potential continuation to the upside. Likewise, the MACD indicator lines remain above the equilibrium level and are angled upward. Therefore, traders may maintain a bullish outlook toward the $113,000 level, or potentially $115,000.