Bitcoin (BTC) Price Prediction: BTC/USDT Trades Above the $90,000 Baseline
Estimated Reading Time: 2 minutes
Don’t invest unless you’re prepared to lose all the money you invest. This is a high-risk investment and you are unlikely to be protected if something goes wrong. Take 2 minutes to learn more

Date: January 14, 2026
The Bitcoin market has finally breached the closely watched resistance near the $95,000 level. The previous session was particularly strong, as reflected by a decisive bullish candlestick. Let’s examine how price action may unfold from here.
BTC/USDT Long-Term Trend—Bullish (Daily Chart)
Key Price Levels
Resistance: $97,500, $100,000, $102,000
Support: $95,000, $92,500, $90,000
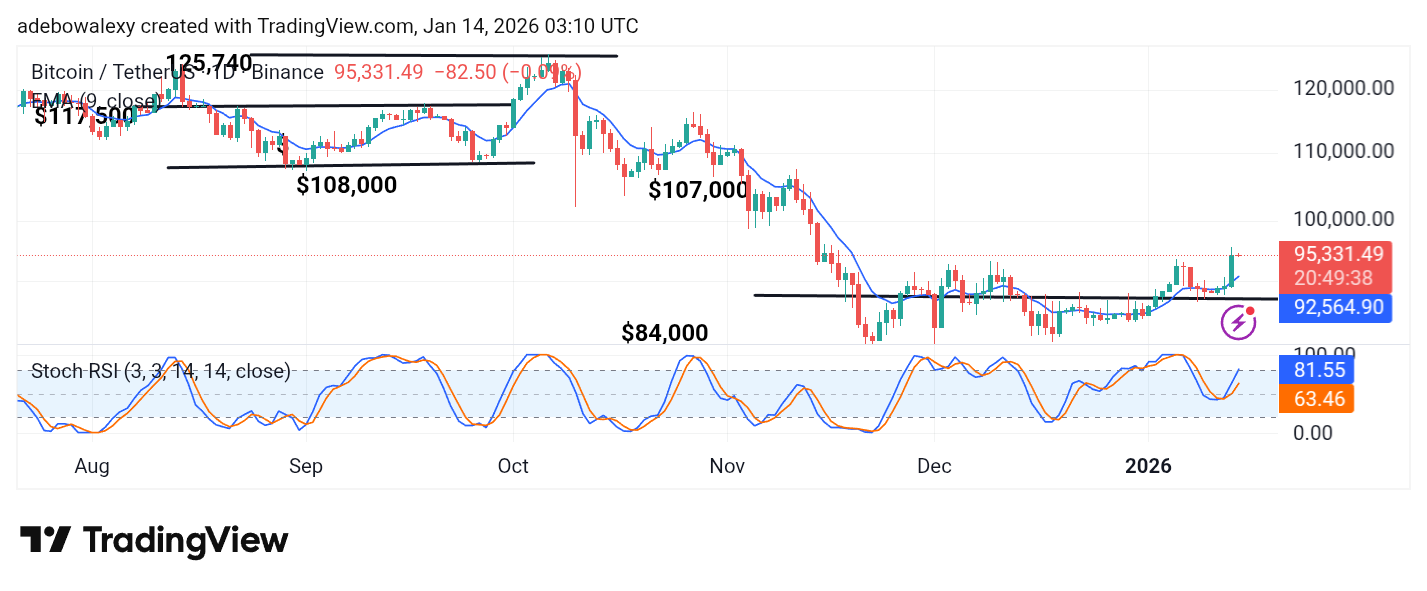
Although the current session is still in its early stages, BTC’s price action remains steady despite mild bearish pressure reflected by the most recent candlestick. The latest candle is a small red one, yet the price continues to trade comfortably above the 9-day Exponential Moving Average (EMA). Meanwhile, the Stochastic Relative Strength Index (SRSI) maintains an upward trajectory, reinforcing the prevailing bullish momentum.
Bitcoin Price Prediction: BTC/USDT Appears to Stay Solid
Despite the modest pullback seen in the ongoing session, the Bitcoin market continues to hold above key technical levels. Price weakness so far has been limited, keeping BTC positioned above critical support zones and sustaining the outlook for further upside movement.
The SRSI lines remain unfazed, continuing along a bullish path. As a result, bearish pressure appears negligible and could be easily absorbed, especially while price action remains above the 9-day EMA on the daily chart.
Bitcoin Price Prediction: BTC/USDT Pullback May Not Be Significant (4-Hour Chart)
On the 4-hour chart, price action is also holding above the 9-day EMA curve. The most recent candlestick is red, but closer inspection suggests that the bearish pullback remains shallow.
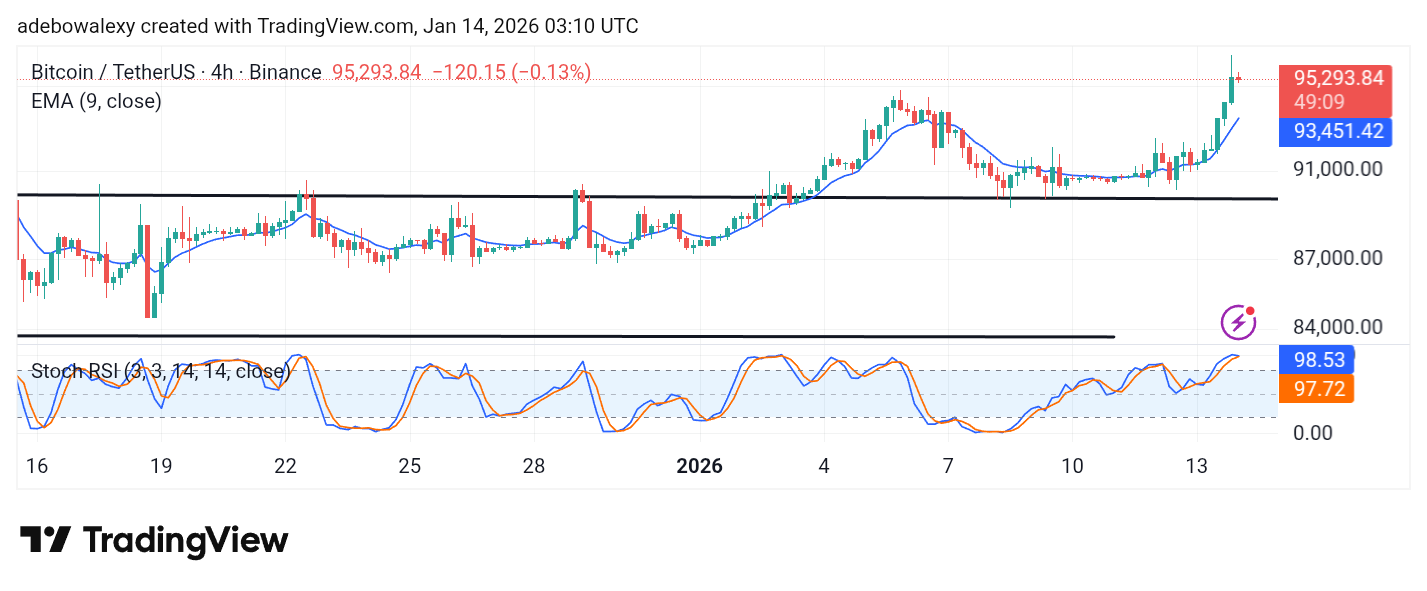
The market continues to stay firm above the EMA, even on this shorter timeframe.
The SRSI indicator lines are currently in the oversold region and moving sideways. This setup suggests the possibility of a rebound from the $95,000 support area, which could open the door for another attempt toward the $100,000 level.