Bitcoin Cash (BCH) Seems to Be Bottoming Out; A Breakout May Occur Soon
Estimated Reading Time: 3 minutes
Don’t invest unless you’re prepared to lose all the money you invest. This is a high-risk investment and you are unlikely to be protected if something goes wrong. Take 2 minutes to learn more

Summary:
- BCH is forming a pattern that suggests a potential breakout.
- MACD signals are improving despite price remaining below the 9-day EMA.
- Long-term targets remain in the $300–$400 range.
Bearish momentum in the Bitcoin Cash market appears to remain significant. However, price action also seems to be approaching a bottom. As a result, the market is forming a pattern that suggests a potential breakout may occur soon. Overall, the cryptocurrency market appears to be at a critical stage.
The Bitcoin Cash Market on the Daily Chart
As mentioned earlier, price action in the BCH market appears highly compressed. Unlike previous downward movements, the market is no longer forming lower lows at the same pace. Instead, price action has developed into a falling wedge pattern, which is often considered a bullish reversal formation.
Despite this, trading activity remains below the 9-day Exponential Moving Average (EMA). Meanwhile, the Moving Average Convergence Divergence (MACD) indicator remains below the equilibrium level, although its lines have begun to slope upward. In addition, the histogram bars have moved into positive territory, albeit with relatively weak momentum, as indicated by their pale green color.
BCH Bulls May Be Applying the Brakes
Although price action suggests that bearish pressure may be easing, traders should remain cautious. Given the current chart pattern, however, an upward breakout appears increasingly likely.
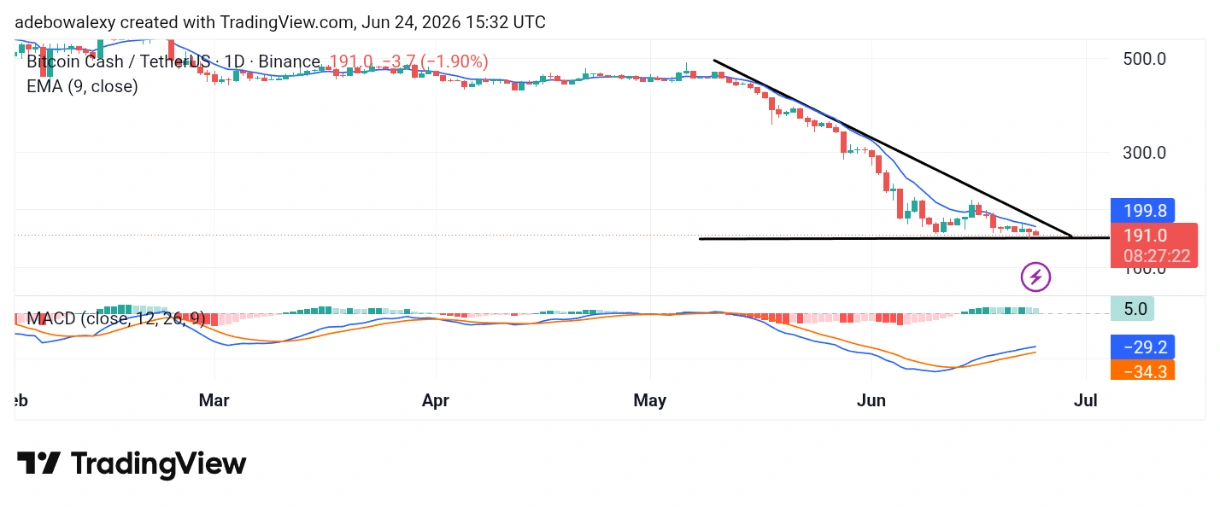
The falling wedge formation suggests bullish momentum could soon take control of the market, triggering a breakout. The MACD indicator also lends some support to this outlook, as its lines continue to trend upward below the equilibrium level. While the strength of any resulting rally remains uncertain, the possibility of a meaningful rebound continues to grow.
What May Happen Next in the Bitcoin Cash Market
The technical signs appear to be aligning in favor of a breakout. However, traders should note that price action remains below the 9-day EMA, suggesting that it may still be too early to adopt an aggressive short-term bullish stance.
Nevertheless, stronger upward movements could emerge in the near future. As a result, traders may consider approaching the market with a longer-term bullish outlook, targeting the $300 to $400 price range.