Bitcoin Cash (BCH/USD) Market Weakens As Failed Swing Signals Looming Downside Risk
Estimated Reading Time: 3 minutes
Don’t invest unless you’re prepared to lose all the money you invest. This is a high-risk investment and you are unlikely to be protected if something goes wrong. Take 2 minutes to learn more
BCH Price Prediction — September 17
BCHUSD Market weakens as failed swing signals looming downside risk. The BCHUSD pair is showing signs of waning momentum after repeated failures to build strength above the $632.0 resistance zone.
Current price action hovers near $592.0, with the 9-day SMA (Simple Moving Average) at $594.0 flattening, reflecting a lack of bullish follow-through. The Stochastic Oscillator, presently around 37, indicates that selling pressure is regaining traction while upside momentum remains capped, reinforcing a bearish tilt in market sentiment.
BCH/USD Market Key Levels:
Resistance levels: $632.60, $680.00, $719.40
Support levels: $524.30, $462.00, $377.90

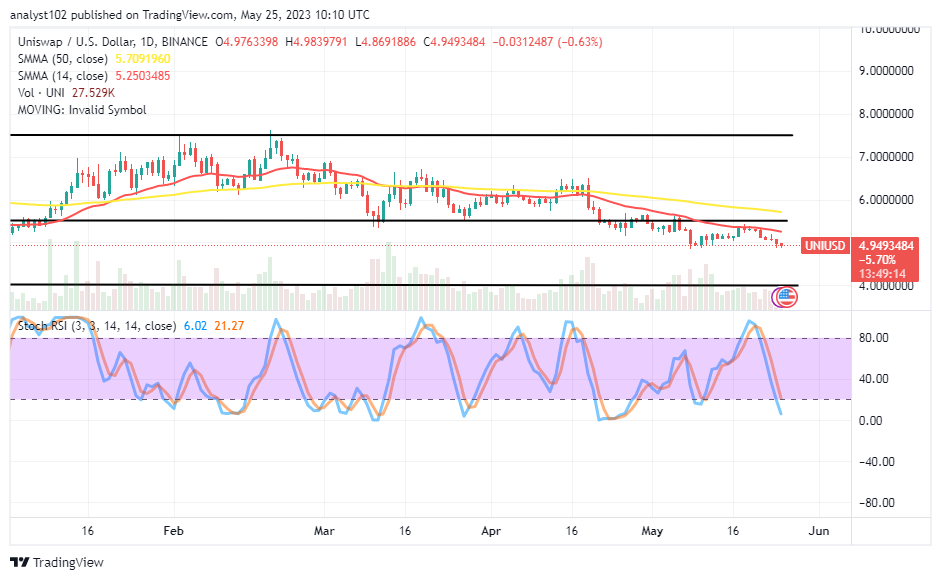
BCH/USD – Daily Chart
The BCH/USD daily chart shows an emerging crash as the price fails to create higher highs.
Technically, price recently formed a failed swing at $632.0, marking an inability to establish new highs and confirming weakness at a critical resistance zone. The subsequent rejection has pressured BCHUSD below near-term averages, with the ascending trendline now under threat of being breached. The inability to defend $560.0 decisively highlights the fragility of bullish control and shifts structural momentum in favor of the bears.
❗️Breakout of the Bullish Pennant on $BCH $BCH is forming a bullish pennant pattern within a bearish market context, suggesting potential upward momentum.
— Crypto AI by Klondike (@KlondikeAI) September 17, 2025
Enter at $601.7, set a stop-loss at $591.0, and aim for a target of $662.9, but be aware of risks from the prevailing… pic.twitter.com/94ncSBVd9F
Breakout Signal on BCH Faces Bearish Headwinds
Although BCH is showing signs of a bullish pennant breakout, the author of the tweet acknowledged that the broader market context remains clearly bearish. Downward pressure continues to dominate, and any short-term rally could prove unsustainable. With momentum still favoring sellers, the risks of a failed breakout and further downside remain high.
What is the projection for the BCHUSD market?
Looking ahead, a decisive breakdown below $560.0 could open the path toward $524.0, a key demand zone that may temporarily stall selling. If bearish momentum accelerates further, the next downside target sits near $462.0, with extended risk pointing to $378.0 should selling intensify. Unless buyers reclaim and hold above $632.0, BCHUSD remains positioned for deeper retracement in the short to medium term.
Bitcoin Cash (BCH) Current Statistics
The current price: $592.20
Market Capitalisation: $12,290,000
Trading Volume: $822,030,000
Place winning BCH trades with us. Get BCH here