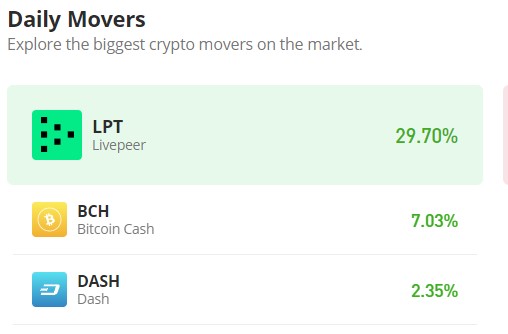
Bitcoin Cash (BCH/USD) May Have Found a Solid Ground Around the $220 Price Level
Estimated Reading Time: 3 minutes
Don’t invest unless you’re prepared to lose all the money you invest. This is a high-risk investment and you are unlikely to be protected if something goes wrong. Take 2 minutes to learn more
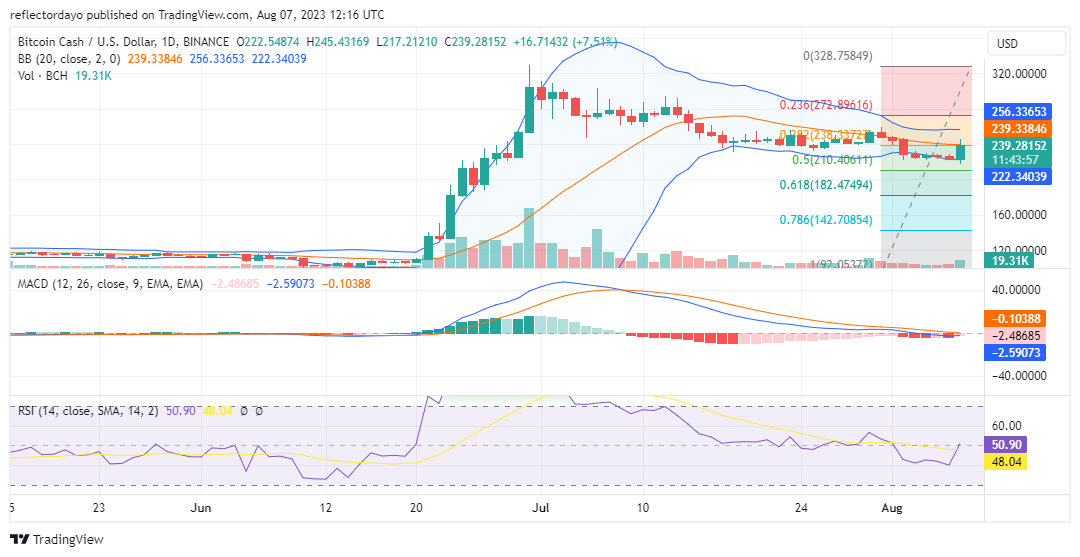
The Bitcoin Cash market has been in a downtrend since June 30, after reaching a high of $329. However, the bearish trend was not devoid of bullish bias, as the presence of bulls in the market slowed down the decline throughout July.
In today’s market, it appears that the bull market has found solid support at the $220 price level. Notably, we observed a significant bullish candlestick, representing a strong bull market emerging from this support level.
BCH Market Data
- BCH/USD Price Now: $240.83
- BCH/USD Market Cap: $4,659,458,427
- BCH/USD Circulating Supply: 19,469,838 BCH
- BCH/USD Total Supply: 19,469,838 BCH
- BCH/USD CoinMarketCap Ranking: #16
Key Levels
- Resistance: $256, $280, and $300.
- Support: $210, $200, and $190.
Price Prediction for Bitcoin Cash: The Indicators’ Point of View
The Bitcoin Cash market is experiencing a bounce-back at the 50% (or 0.5) Fibonacci retracement level, currently at the $210.4 support level. The long-term price retracement, which commenced on June 30, has taken considerable time to retrace halfway of the last bull run, presenting a potential point for the market to rally.
Based on analysis using three indicators, it is evident that the market has now retraced back to equilibrium, signifying a significant step in the recovery process. With demand and supply now balanced, bulls need to exert more effort to establish a rally. Traders should closely monitor the market, as it needs to rise well above the 20-day moving average to confirm an upside retracement. If the market remains in equilibrium, there is a possibility of a consolidation trend.
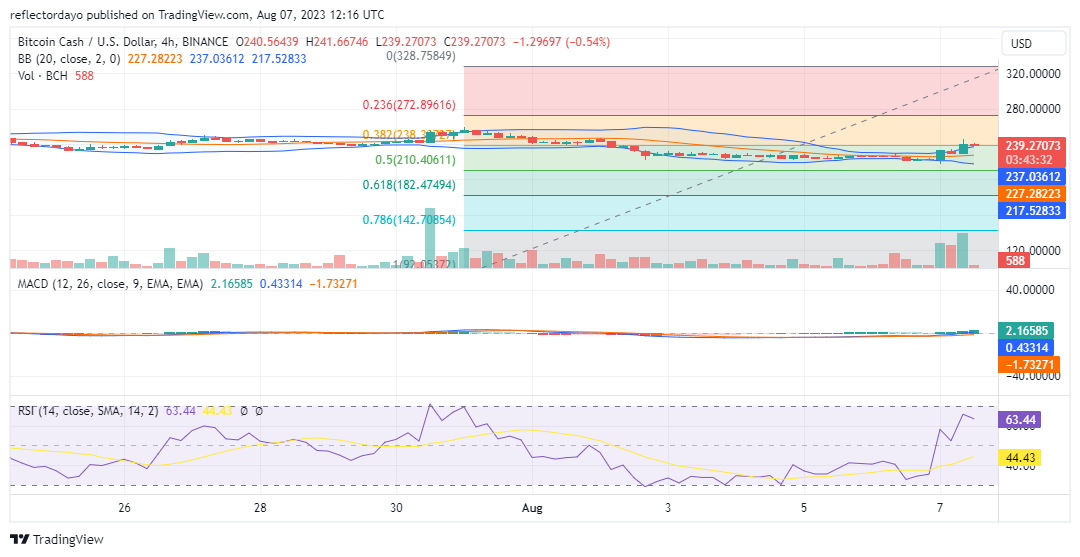
BCH/USD 4-Hour Chart Outlook
The Bitcoin Cash market has experienced a significant breakout from the previous consolidation trend around the $225 price level. The upside breakout was initiated when the market dropped below the $220 price level. During this breakout, trading volume surged as investors seized the opportunity to buy at the lower price.
However, the market encountered resistance near the $240 price level, which is currently acting as a significant obstacle. Both support and resistance levels are converging, and if bulls are unable to overcome the $240 resistance level, the market might consolidate within the $240 price zone.