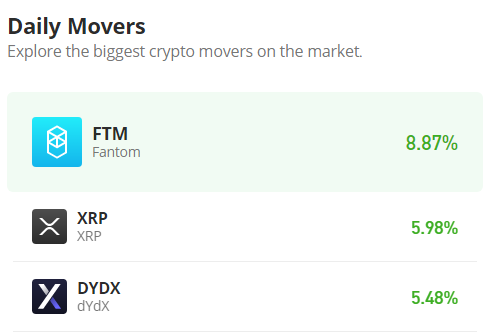
BNB (BNB/USDT) Displays Recovery Signs Amid Market Consolidation
Estimated Reading Time: 3 minutes
Don’t invest unless you’re prepared to lose all the money you invest. This is a high-risk investment and you are unlikely to be protected if something goes wrong. Take 2 minutes to learn more
The market for BNB against Tether in the last 24 hours has experienced a 1.72% rise to $901.84, surpassing the broader 1.1% gains. As it stands, analysts are of the opinion that the surge in AI ecosystem activity, such as Non-Fungible Agents (NFAs), and growth within the broader market ecosystem are the contributing factors to the technical factors.
As it stands, the pair is technically showing signs of an impending breakout, as indicated by the convergence of the Guppy Multiple Moving Averages (GMMA) and MACD, signaling that the bulls are poised to take over momentarily.
Currently, BNB trades at $902.97 with more than 65,180 volumes for the day.
Technical Indicators
Major Resistance Levels: $906.91, $956.00, and $1,000.00
Major Support Levels: $895.43, $850.00, and $800.00
Technical Analysis
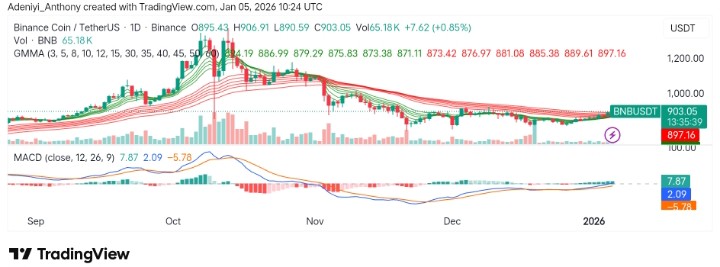
Technically, BNB against Tether on the daily chart appears to be moving with a narrowing price range initially. As it stands, the GMMA is showing a near-bullish market sentiment as the set of EMAs seems to be fused together, signaling a potential shift in trend as the market waits for a clear breakout.
Additionally, the MACD shows a divergence with the histogram, indicating a mild bullish momentum. This is suggesting more development if more bullish efforts are applied.
To this end, the pair appears to have moved slightly above its opening price of $895.43; an improvement above $906 may indicate continued upside.
$BNB / USDT ( update )
Significantly profit trade. Called on TL as before. Imo, the new resistance is yet to happen probably around 1200$. If not clear to hit 1600$ this cycle.
W is a w @cz_binance @binance 🤝👏 https://t.co/i2MhbPg2fN pic.twitter.com/KzFCYXNyEb
— Crypto King👑💎 (@cryptosanthoshK) January 5, 2026
Meanwhile, @Crypto_king has reported that BNB/USDT has experienced significant profits compared to previous predictions on X. The analyst is of the opinion that after the current phase, the new resistance for BNB could be around $1,200 or $1,600, potentially.
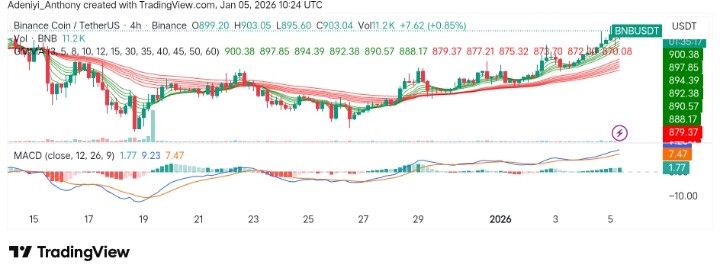
BNB/USDT Analysis: Awaiting Signs of Bullish Continuation
On the 4-hour chart, BNB/USDT is demonstrating a slight upside move, reaching for the $903 level. The GMMA appears to be fanning upward, showing impressive buying pressure with a noticeable bullish divergence.
However, a signal from the MACD shows that the pair is currently overbought, as potential resistance lies ahead around $906. With the volume indicator indicating increasing activities, a minor pause in movement may be seen at $906 before further continuation.
You can purchase crypto coins here. Buy Crypto