BNB (BNB/USDT) Halts Bullish Momentum Near $641.01 Amid Growing Market Caution
Estimated Reading Time: 3 minutes
Don’t invest unless you’re prepared to lose all the money you invest. This is a high-risk investment and you are unlikely to be protected if something goes wrong. Take 2 minutes to learn more
BNB Long-term Analysis: Ranging
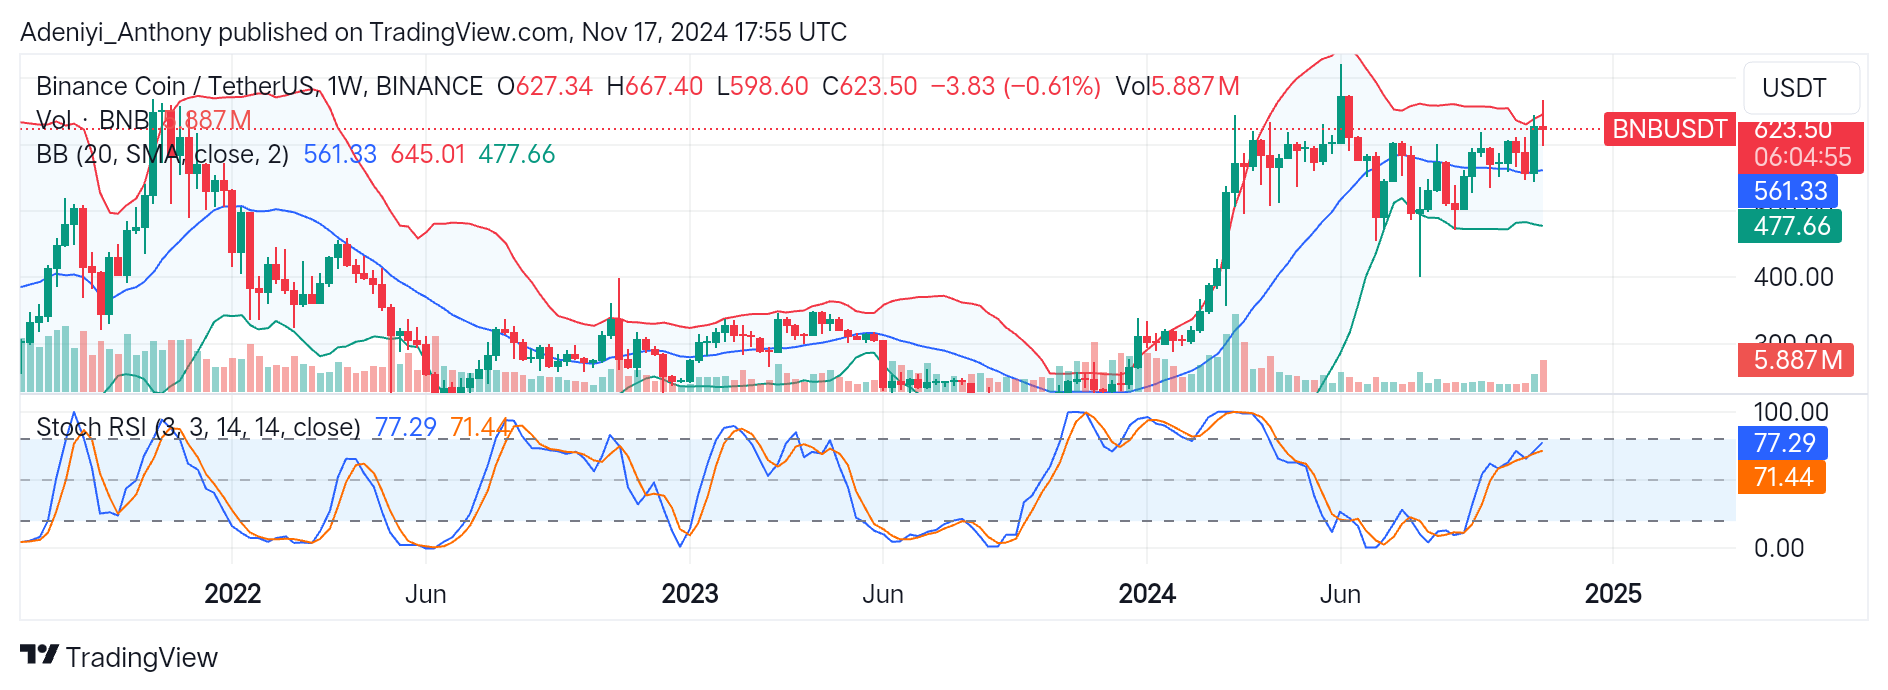
BNB against the Tether from previous trades appears to be consolidating near a critical level after a rally from the first half of the year. The pair seems to be hovering between a tight region of the Bollinger bands, suggesting the continuous struggle between the bulls and the bears.
In recent moves, BNB seems to be facing significant resistance at $645.01. However, the formation of bearish candlestick suggests BNB/USDT may be retracing away from this crucial level, leaving traders to ponder what the next move might be.
Currently, BNB/USDT is trading at $623.50 with a moderate weekly trading volume of 5.887 million.
Technical Indicator
Major Resistance Levels: $645.10, $700, and $750
Major Support Levels: $561.33, $477.66, and $400
BNB Technical Analysis
For several weeks, BNB has been operating within a close range. The Bollinger bands highlight the pair has been ranging within the $477 and $645 levels, suggesting a period of low volatility. However, with the current price action near the dynamic upper resistance, the pair seems overbought and due for a potential reversal, as BNB needs more buying pressure to push beyond $645.01.
On the other hand, the Stochastic RSI pictures the pair is near-overbought region, as the blue and orange lines read 77.29 and 71.44, respectively. This is an indication that BNB/USDT may be due for a correction or at least a sideway movement before gaining upside traction, as the lack of volume raises concerns about the sustainability of the bullish momentum.
In the near term, traders should watch the $561.33 level to ascertain the next direction.
BNB/USDT Analysis: What is Next?
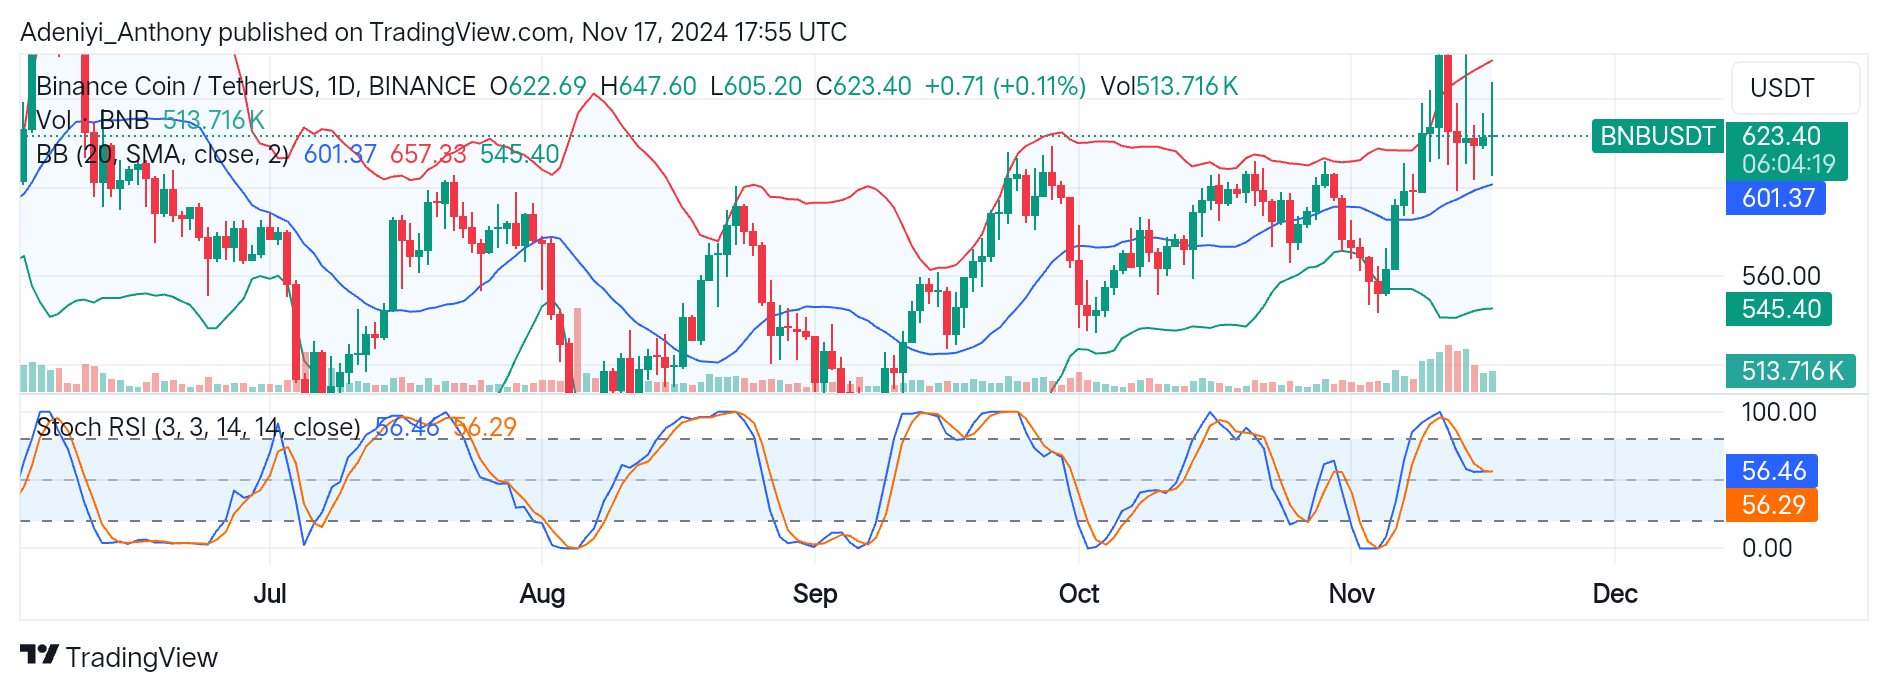
On a daily timeframe, BNB/USDT is trading near $657 at the upper segment of the Bollinger bands. This is an indication that the pair is currently overbought and lacks buying momentum, as seen in the current trading volume of 513.716K.
Contrarily, the Stochastic oscillator suggests the pair has room for more upside improvement. However, the pair may range between the $601 and $657 levels, as the traded volume indicates traders’ indecisiveness.
Therefore, if buying pressure increases, the pair could breach the $657 level with target locked on higher resistance levels. Conversely, failure to hold above the mid-band at $601, the pair could retrace to the $545 level.
You can purchase crypto coins here. Buy LBlock