BNB (BNB/USDT) Prepares for Bullish Breakout Amid Weekly Consolidation
Estimated Reading Time: 3 minutes
Don’t invest unless you’re prepared to lose all the money you invest. This is a high-risk investment and you are unlikely to be protected if something goes wrong. Take 2 minutes to learn more
BNB Long-term Analysis: Bullish
The market for BNB against the Tether faced a sharp rally to the north at the beginning of the year 2024 and since then has entered a tightened consolidation phase, ranging within range with the sellers dominating. However, despite the recent pullbacks, the pair has shown resilience in holding above the longer-period simple moving averages. Now, BNB is showing signs of a potential movement toward the north as the pair receives bullish attention.
Recently, the signal given by the Stochastic RSI suggests the pair’s upside movement from the oversold zone could be brewing. The strong resistance above calls for caution, as the potential momentum might need to break above $650 before a strong trend can be confirmed.
Currently, BNB trades at $603.69, recording close to a hundred traded volumes already.
Technical Indicators
Major Resistance Levels: $624, $650, and $710
Major Support Levels: $590, $580, and $480
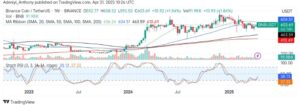
BNB Technical Analysis
The analysis for BNB against the Tether on the weekly timeframe shows the pair is focused on moving to the north as breakout expectation increases. However, despite the impending move, the volume and the resistance ahead as given by the 50-period moving averages indicate this might be an early sign, and more strong indications are needed for engagement.
On the other hand, the Stochastic RSI suggests the momentum is building as the blue line extends into the 30-mark level. To this end, the flat volume and slight noticeable uptick suggest accumulation and a move toward the $650 would determine a breakout or a breakdown.
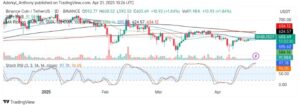
BNB/USDT Analysis: Can the Price Break Above the 200 SMA?
On the daily chart, BNB/USDT appears to be trading under the longer-term simple moving averages. However, the price seems to be squeezed between the 50 and 100 dynamic lines, but with a strong trajectory towards the $634 level.
On the other hand, the Stochastic RSI shows the pair is overvalued and near exhaustion as the daily volume indicator suggests the bulls are just entering the market.
To this end, if momentum is sustained, and a close above $624 is actualized, more upside move would be confirmed. Conversely, if the bulls fail to defend the $584 Ievel, the bears may resume operations.
You can purchase crypto coins here. Buy LBlock