BNB Slides as It Returns to Its Prior Low of $551
Estimated Reading Time: 2 minutes
Don’t invest unless you’re prepared to lose all the money you invest. This is a high-risk investment and you are unlikely to be protected if something goes wrong. Take 2 minutes to learn more

BNB (BNB) Long-Term Analysis: Bearish
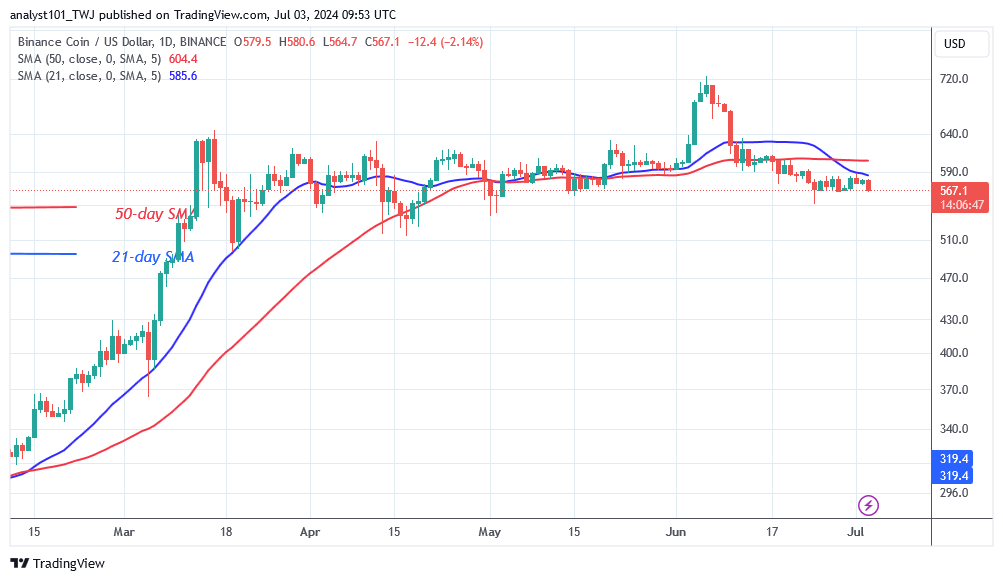
The price of BNB has been fluctuating between $560 and below the moving average lines but returns to its prior low of $551. The cryptocurrency asset is declining as bears attempt to breach the present support level of $560. On the upside, assuming the current support holds, BNB will continue its range-bound trend. Furthermore, if the crypto’s price breaks above the moving average lines, BNB will return to its prior high of $635.
On the other hand, if the bears break the current support of $560, the market will retest its previous low of $551. Meanwhile, the bears have broken the present support as BNB reached a low of $559.
Technical indicators:
Major Resistance Levels – $600, $660, $720
Major Support Levels – $400, $340, $280
BNB (BNB) Indicator Analysis
BNB is declining, while horizontal moving average lines are sloping downward. The 21-day SMA has crossed below the 50-day SMA, signaling a bearish indication. Currently, BNB is approaching its prior low of $551. In recent price action, extended candlestick tails pointed to the previous low of $511, signaling significant buying demand at lower price levels.
What Is the Next Direction for BNB (BNB)?
BNB is declining below the moving average lines as it returns to its prior low of $551. Bulls and bears have been in a price tussle above the $560 support level today. If the bulls succeed, BNB will continue its range-bound move. However, the altcoin will return to its prior low of $551 where bears have control of the price. Meanwhile, the crypto signal remains range-bound, with the altcoin trading below the moving average lines.

You can purchase Lucky Block here. Buy LBLOCK
Note: Cryptosignals.org is not a financial advisor. Do Research before investing your funds in any financial asset or presented product or event. We are not responsible for your investing results.