Cardano (ADA/USDT) Bearish Momentum Approaches Key Support Level
Estimated Reading Time: 3 minutes
Don’t invest unless you’re prepared to lose all the money you invest. This is a high-risk investment and you are unlikely to be protected if something goes wrong. Take 2 minutes to learn more
In the last 24 hours, the market for Cardano against Tether has risen 1.15% but is still performing below expectations. As it stands, the pair’s modest gain seems to align with the technical rebounds, which were spurred by KuCoin’s 3 million reward campaign, and the macro relief due to the post-Japan rate hike activity.
At the moment, the pair appears to be showing recovering signs, but the price is still operating below the cluster of moving averages as favorable signals emerge from the Stochastic RSI.
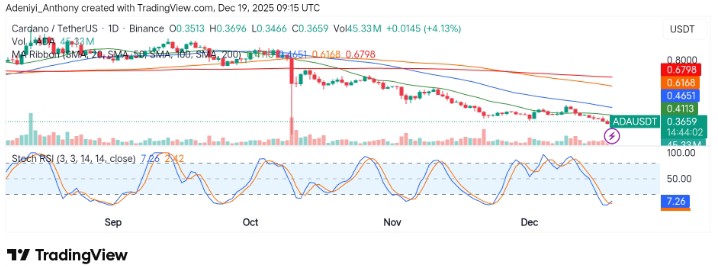
Currently, Cardano trades at $0.3659 with more than 45 million traded volumes for the day.
Technical Indicators
Major Resistance Levels: $0.4651, $0.6168, and $0.6798
Major Support Levels: $0.3650, $0.3513, and $0.3466
Technical Analysis
Technically, the direction for Cardano against Tether appears to be dictated purely and extensively by the bears; the price seems to have faced a serious rejection after hitting the $0.4651 resistance level. However, recent price action suggests the bulls may be taking action, but the market sentiment appears to be negative, with the price consistently below the 20, 50, 100, and 200 SMA, suggesting overall weakness.
From another angle, the Stochastic RSI seems to be displaying a potential move to the upside as the lines curl upward from the oversold region. To this end, with the moderate rate of market participation, a move into the $0.4600 may be recorded again, but for now, the bears are in control.
Update on Cardano
Cardano has taken an extensive move downward again without any signs of a bounce in recent times, with the $0.322 standing as the next support level. From Elliot’s point of view, the pair has not displayed a five-wave move up, as the price seems to settle above immediate support despite massive volumes. To this end, the token is taking the route to the south, but this might likely lead to a bullish breakout as soon as the bulls find it attractive.
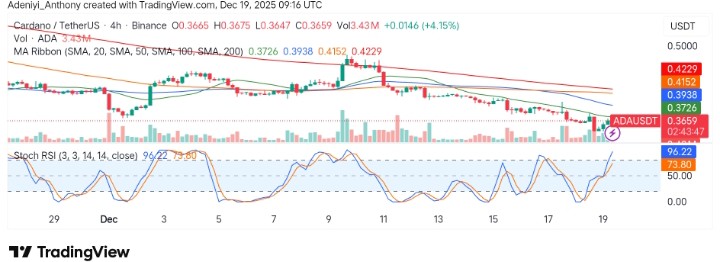
ADA/USDT Analysis: Fading Bullish Momentum
On the 4H chart, ADA/USDT seems to have recorded a mild momentary bullish attempt. However, this was followed by price consolidation as the price continued to operate below the critical moving average. As it stands, the trend is still affected by the bears as the momentum oscillator extends into the overbought zone, indicating bearish continuation in the near term.
To this end, if the price can hold above $0.3650, a renewed bullish interest would spark a move into the $0.4000 zone; otherwise, a fall below the current level would suggest a continuation of the previous trend.
You can purchase crypto coins here. Buy Crypto