Cardano (ADA/USDT) Faces Major Resistance as It Struggles to Push Higher
Estimated Reading Time: 3 minutes
Don’t invest unless you’re prepared to lose all the money you invest. This is a high-risk investment and you are unlikely to be protected if something goes wrong. Take 2 minutes to learn more
Over the last 24 hours, the Cardano-to-Tether market has dropped about 2%, underperforming the broader crypto market. Meanwhile, this decline can be attributed to market-wide risk-off sentiment, as shown by the fear and greed indicator.
From another angle, traders are also taking profits at the moment as a result of the recent rebound of 13% since late November.
Additionally, the pair at the moment is facing technical resistance near the $0.50 mark, a psychological level it has struggled to surpass since June 2025.
Currently, Cardano trades at $0.4402 with more than 20.9 million traded volumes for the day.
Technical Indicators
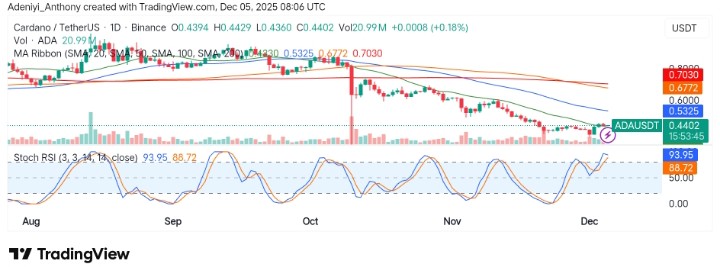
Major Resistance Levels: $0.5325, $0.6772, and $0.7030
Major Support Levels: $0.4245, $0.4000, and $0.3500
Technical Analysis
Technically, Cardano against Tether has recently tested the $0.4402 price zone and is facing resistance at the $0.5325 level. Meanwhile, this strong bullish momentum from the past few weeks suggests a potential short-term upward move if the price holds above the support level. However, the Stochastic RSI at 93.95 signals the potential for a correction.
To this end, the price needs to overcome resistance at $0.5325 and $0.6772 to continue its bullish run.
The price is pushing aggressively higher and has now broken above the late-November highs. However, this move does not confirm a bullish reversal. The chart is still far from validating a larger trend change, and the recent rally does not yet provide structural evidence of… pic.twitter.com/tfIEq0aDET
— More Crypto Online (@Morecryptoonl) December 4, 2025
Meanwhile, @Morecryptoonline has discussed on X (formerly Twitter) recent Cardano price action, noting that it is pushing higher and has broken above the late-November highs. However, the analyst also suggested that this move does not confirm a bullish reversal, as the chart still lacks structural evidence of a larger trend change.
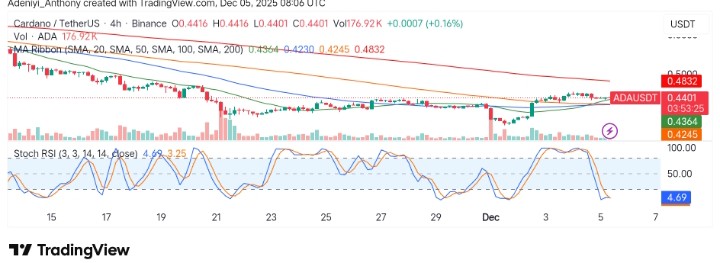
ADA/USDT Analysis: Attempting to Hold Above Support
On the 4-hour chart, ADA/USDT is showing signs of a potential bounce after hitting a major support level at $0.4245. The Stochastic RSI is currently at 4.69, indicating that the market is in an oversold condition and could be due for a short-term reversal.
However, the price is still hovering just above the $0.4364 support, and a break below this level would signal further weakness. Meanwhile, if ADA can hold above the $0.4364 mark and move past the immediate resistance at $0.4832, there could be potential for a bullish reversal in the short term.
You can purchase crypto coins here. Buy Crypto