Cardano (ADA/USDT) Price Faces Key Resistance as Stochastic RSI Signals Potential Correction
Estimated Reading Time: 3 minutes
Don’t invest unless you’re prepared to lose all the money you invest. This is a high-risk investment and you are unlikely to be protected if something goes wrong. Take 2 minutes to learn more
The price of Cardano against Tether has been experiencing volatility, recently finding some resistance around the $0.9064 level. As it stands, after reaching recent highs, the market sentiment shows signs of indecision, as indicated by the mixed movement of price action. However, the overall trend seems to be bullish, but the technical indicators hint at possible correction period in the near term.
To this end, the market behavior suggests a key price inflection point, as Cardano trades at $0.9064 with more than 55 million traded volumes for the day.
Technical Indicators
Major Resistance Levels: $0.9180, $0.9320, and $1.2000
Major Support Levels: $0.8488, $0.7630, and $0.7359
Cardano Technical Analysis
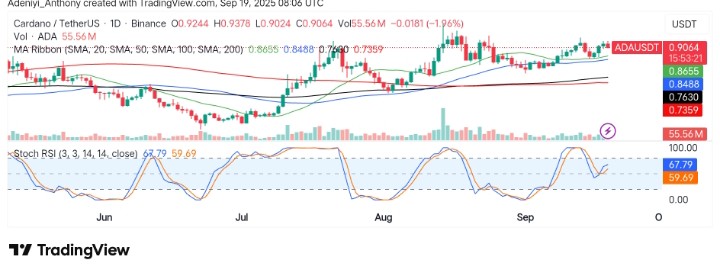
Technically, the price of Cardano against Tether has been on an upward trajectory but is facing resistance near the $0.9180 level. As seen in the chart, the moving averages (20, 50, 100, and 200) are providing crucial support.
However, there appears to be a slight divergence in the Stochastic RSI, where the blue line has reached a level of 67.79, signaling that the asset may be nearing overbought conditions. This suggests that the price may consolidate or face a short-term pullback before another leg up.
To this end, if the pair can break above the nearest resistance, a bullish trend will be confirmed; otherwise, the pair risks a break below $0.8488 or $0.7630.
Breakout for Cardano is Coming?
After a major incident concerning the Fed rate cut, Cardano appears to be moving close to its major upper limit. However, fundamentals like market cap and TVL remain flat, suggesting that for now, ADA may continue to move between the $0.9000 region. To this end, watching the price movement seems appropriate to catch any sudden move in the market.
ADA Short-term Analysis: Potential Cooling Looming
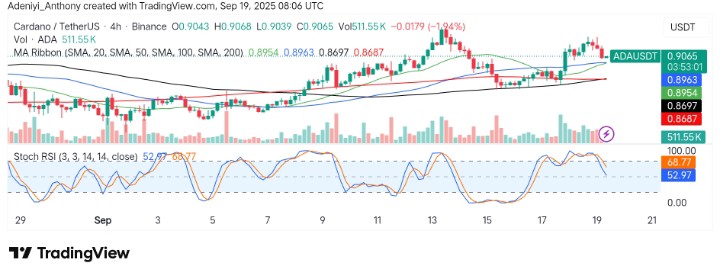
The ADA/USDT chart on the 4-hour timeframe reveals a strong rally that encountered resistance near the immediate peak on the daily timeframe. The price is currently hovering above the 20- and 50-day moving average, indicating short-term bullish sentiment. However, the Stochastic RSI is showing a level of 68.77, suggesting that the market might have reached the overbought position as the lines extend to the south.
On one hand, this could suggest a slight pullback for a bigger move only if the immediate support can remain strong. On the other hand, if this level fails to hold, the pair may face further downside. The strong support near 0.8697 could serve as a buffer, but if the price fails to maintain above this level, it may face further downside towards $0.8448.
To this end, caution is needed, as a reversal near a resistance may suggest a take-profit action, but a break above $0.9120 would reignite more bullish actions.
You can purchase crypto coins here. Buy Crypto