Cardano’s Price Varies and Is Stuck Around $0.65
Estimated Reading Time: 2 minutes
Don’t invest unless you’re prepared to lose all the money you invest. This is a high-risk investment and you are unlikely to be protected if something goes wrong. Take 2 minutes to learn more

Cardano (ADA) Price Long-Term Forecast: Bearish
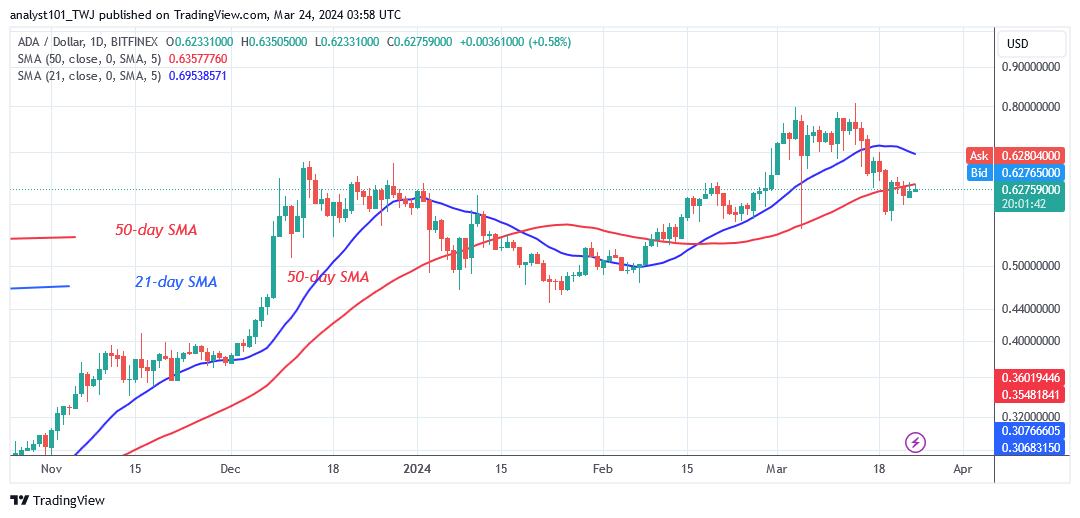
Cardano’s (ADA) price has fallen below the moving average lines and is stuck around $0.65. On March 19, 2024, the altcoin declined from its high of $0.80 to a low of $0.58. This is the second time the altcoin will test its present support. The altcoin had already plummeted to a low of $0.55 on March 5, 2024, but bulls bought the dips. The upward movement hit resistance at $0.80.
Today, the altcoin is recovering from its second dip. The upward trend is being held back by the moving average lines or resistance at $0.65. Cardano will resume positive momentum if it breaks above the moving average lines. The altcoin will test its previous high of $0.80. The ADA’s price will range from $0.58 to $0.65 if it is rejected at the moving average lines.
The ADA/USD exchange rate is now $0.62.
Technical Indicators:
Major supply zones: $1.0, $1.05, $1.10
Major demand zones: $0.25, $0.20, $0.15
Cardano (ADA) Indicator Analysis
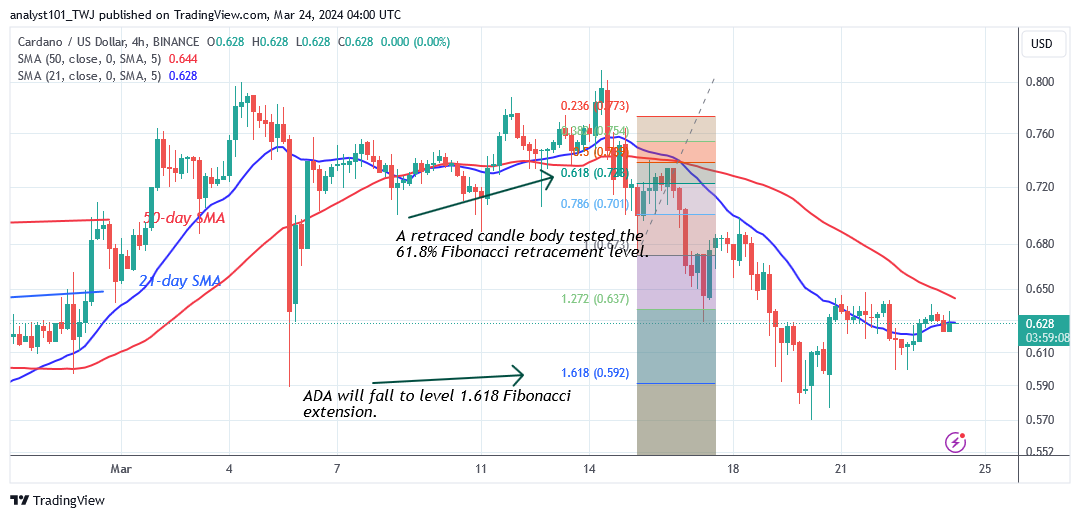
Following the current downturn, both charts show price bars below the moving average lines. The moving average lines are trending up, indicating the prior trend. However, on the 4-hour chart, the moving average lines are sloping downward, indicating a current trend.
What Is the Next Move for Cardano (ADA)?
On the 4-hour chart, Cardano’s price is falling below the moving average lines and is stuck around $0.65. The cryptocurrency asset has fallen to 1.618 Fibonacci extension, or $0.59. The upward corrective has stalled at the resistance at $0.65 or the moving average lines. The cryptocurrency price bars are dominated by Doji candlesticks, causing the altcoin to consolidate and remain stagnant.
The crypto signal varies as the altcoin changes within a range.
You can purchase Lucky Block here. Buy LBLOCK
Note: Cryptosignals.org is not a financial advisor. Do your research before investing your funds in any financial asset or presented product or event. We are not responsible for your investing results