Chainlink Fluctuates above $13 as a Downturn Approaches
Estimated Reading Time: 2 minutes
Don’t invest unless you’re prepared to lose all the money you invest. This is a high-risk investment and you are unlikely to be protected if something goes wrong. Take 2 minutes to learn more

Chainlink (LINK) Long-Term Analysis: Bearish
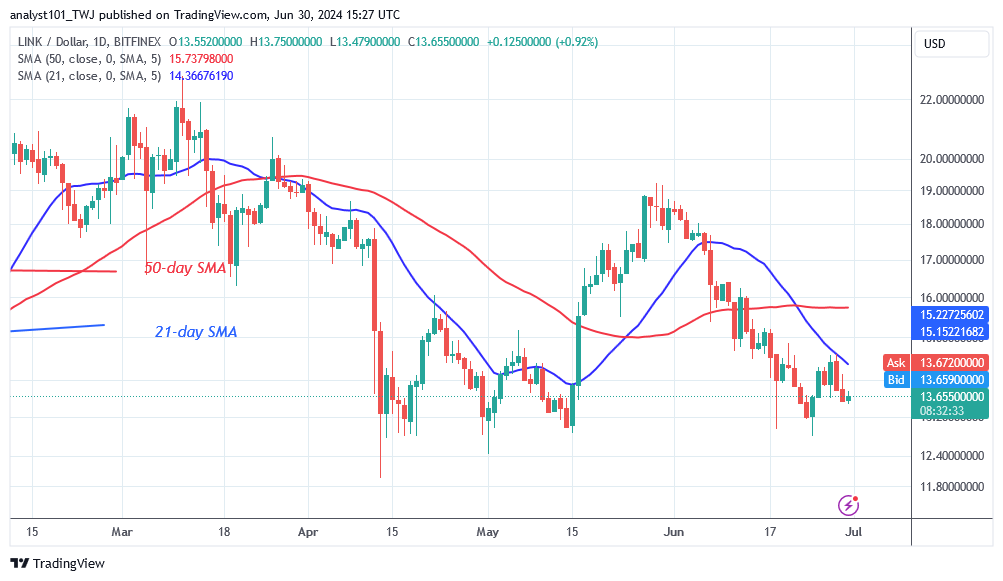
Chainlink’s (LINK) price has fallen below the moving average lines as a downturn approaches. On June 18 and 24, the bears tested the support at $13 and then pulled back. The cryptocurrency is currently trading in a narrow range between $13 and the resistance at the 21-day SMA or the $15 high.
The altcoin trades in a tight range and may experience a price rebound or breakdown. If the price breaks above the moving average lines, Chainlink will enter a bullish trend zone. The positive momentum will continue till the high of $18. The cryptocurrency may fall if it is rejected at the moving average lines.
On the negative, if the bears break through the current support at $13, the altcoin would retest its prior low of $11.96. The bearish momentum will continue till the low of $10. Chainklink is currently worth $13.69.
Technical indicators:
Major Resistance Levels – $20.00, $22.00, $24.00
Major Support Levels – $12.00, $10.00, $8.00
Chainlink (LINK) Indicator Analysis
The price bars on both charts are lower than the moving average lines, indicating that the cryptocurrency may be declining. Meanwhile, the 21-day SMA is reversing the rising trend. Nonetheless, more rejection will lead to the altcoin’s collapse.
What Is the Next Direction for Chainlink (LINK)?
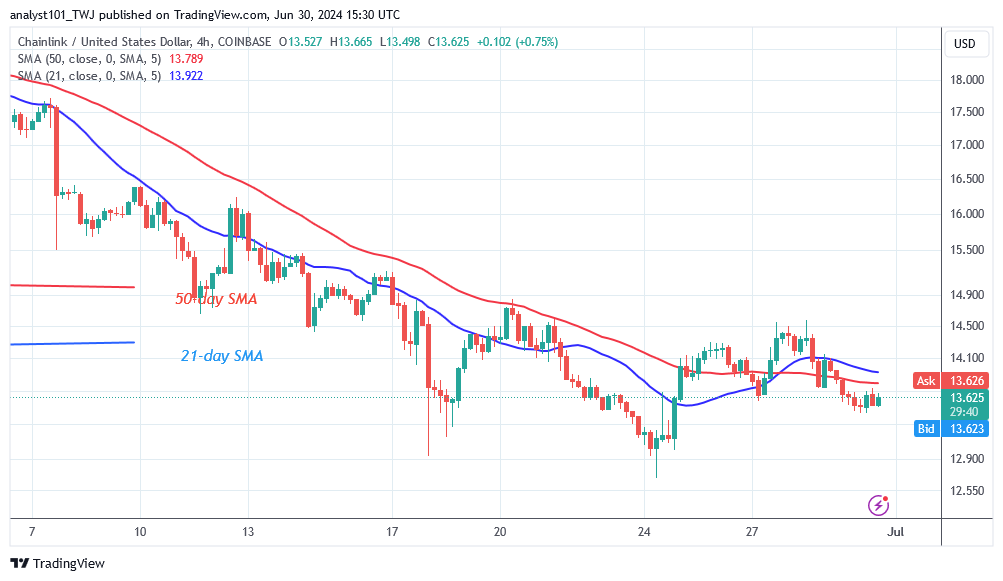
Chainlink’s 4-hour chart shows a sideways trend as a downturn approaches. The altcoin is now trading between $12.80 and $14.50. The altcoin is now oscillating above $13 but below the moving average lines. If the cryptocurrency falls below its current support level of $13, it faces a plunge. Meanwhile, the crypto signal is negative because it is rejected by the moving average lines.
You can purchase Lucky Block here. Buy LBLOCK
Note: Cryptosignals.org is not a financial advisor. Do your research before investing your funds in any financial asset or presented product or event. We are not responsible for your investing result.