Chainlink (LINK) Keeps Attracting More Attention from Investors
Estimated Reading Time: 3 minutes
Don’t invest unless you’re prepared to lose all the money you invest. This is a high-risk investment and you are unlikely to be protected if something goes wrong. Take 2 minutes to learn more

Summary:
- LINK remains bullish, supported by Chainlink adoption and strong investor interest.
- Technical indicators are positive, with price above the 9-day EMA, though SRSI remains overbought.
- Potential targets: LINK could break $10 and move toward $15–$20 if momentum continues.
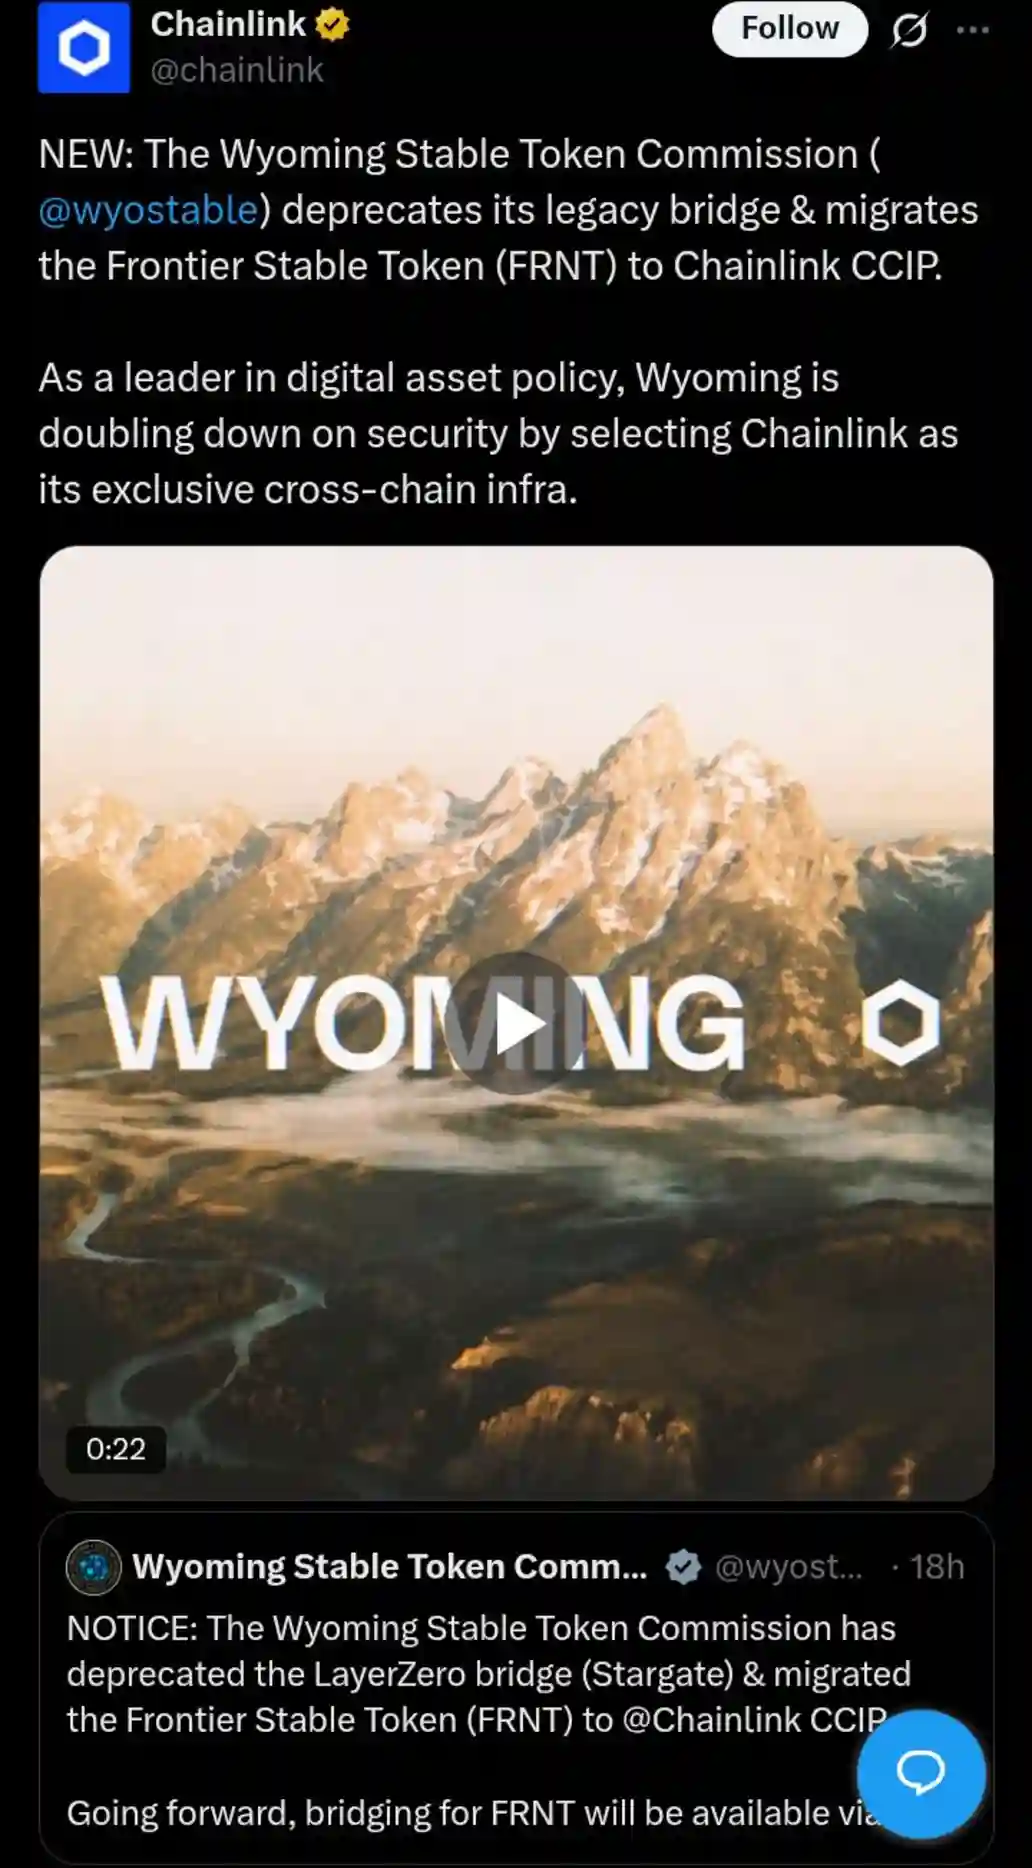
The Chainlink token has shown a significant correlation between its price and the favorable fundamentals surrounding the project. Wyoming Stable Token has adopted Chainlink as its cross-chain infrastructure, which has had a positive influence on the token’s price movement.
What Is the Chainlink 24-Hour Price Chart Telling Us?
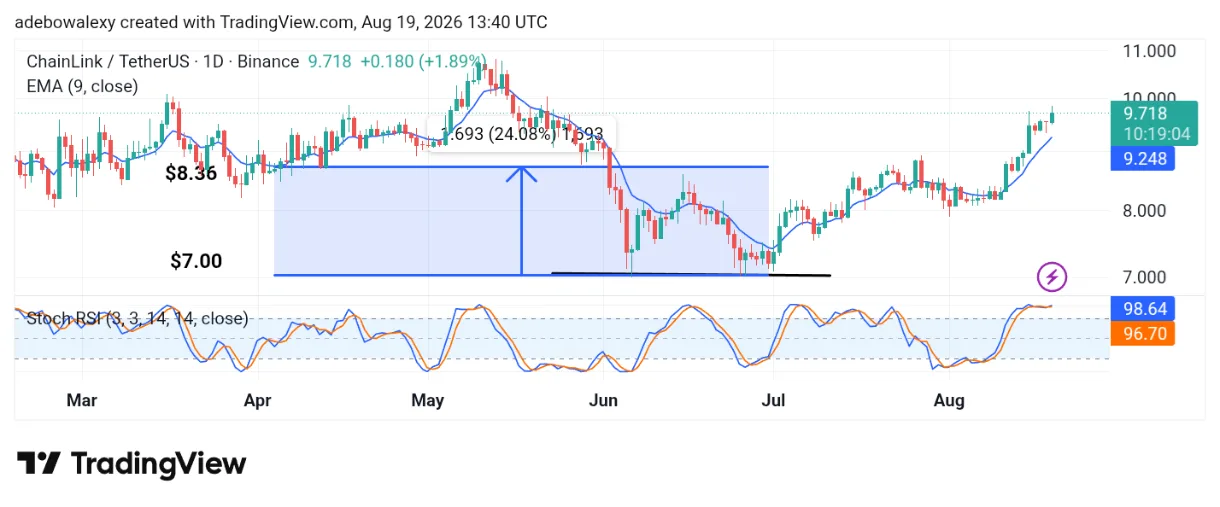
Looking at the LINK/USDT daily price chart, we can see that price action has been strongly bullish over the past nine sessions. The ongoing session also remains under the influence of bullish forces. The latest price candle on the daily chart is positioned above the 9-day Exponential Moving Average (EMA).
Meanwhile, the Stochastic Relative Strength Index (SRSI) lines remain in the overbought region and are moving sideways, although the leading line continues to point upward.
LINK Bullish Momentum Remains Strong
As the Chainlink project continues to attract investors’ attention, sentiment surrounding the token remains strongly bullish. This Recent price action reflects this In its recent price action. Buying pressure has dominated most sessions, as shown by the bullish price candles.
The SRSI lines have also remained in the overbought region, despite the potential for a pullback under such conditions. This suggests that bullish momentum remains strong, likely fueled by growing investor interest.
Chainlink May Be Difficult to Read Currently
Since the SRSI has remained in the overbought region for some time, it is difficult to determine when a bearish reversal crossover may occur. As a result, traders using this indicator may need to pay closer attention to the 9-day EMA for additional confirmation.
Nevertheless, if the current bullish momentum continues, LINK could break through $10 and advance toward $15 and $20.