Chainlink (LINK/USDT) Price Compresses Near $14.00 as Potential Breakout Looms
Estimated Reading Time: 4 minutes
Don’t invest unless you’re prepared to lose all the money you invest. This is a high-risk investment and you are unlikely to be protected if something goes wrong. Take 2 minutes to learn more

For a while, Chainlink against Tether has been trading around the $13.7-$13.8 zone. This shows that the pair is showing a clear sign of price compression after what seems to be a prolonged corrective phase.
As it stands, the daily depicts a stabilization, transiting from a distributive phase with declining momentum as the Guppy Multiple Moving Averages (GMMA) coil together. To this, if bullish momentum increases in the coming session, a technical breakout may be seen.
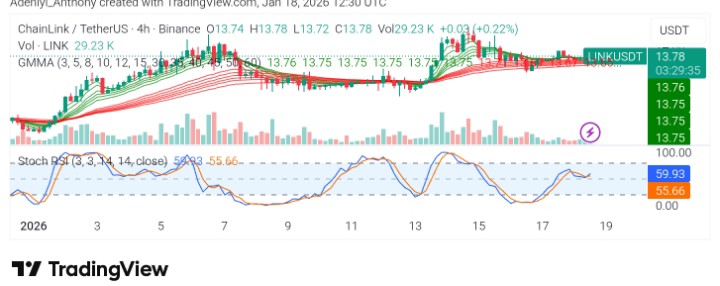
Currently, Chainlink trades at $13.78 with over 520,000 traded volumes on the daily chart.

Technical Indicators
Major Resistance Levels: $14.20, $15.40, and $16.80
Major Support Levels: $13.40, $12.80, and $12.20
Chainlink Technical Analysis
Technically, Chainlink against Tether remains within the cluster of the exponential moving averages, indicating that the trend is still neutral as the pair builds a base. However, the compression between the price and moving averages suggests bearish momentum is dropping steadily, with the momentum oscillator signaling an impending upside move.
To this end, a bullish confirmation would require above $14.20, while a break below $13.40 would invalidate the technical analysis.
Chainlink Poised for Significant Gains?$LINK has been trading within a tight range, but may rebound due to emerging catalysts.
Read more: https://t.co/gvO4Jckr1w pic.twitter.com/Ft5npFHR5I
— BlockzHub News (@blockz_hub) January 17, 2026
Meanwhile, @blockz_hub has suggested Chainlink is showing signs of a potential breakout from a prolonged consolidation within a tight range. The analyst is of the opinion that the token has managed to hold above a key support level with weakening selling pressure. To this end, it was stated that the token is preparing for a breakout even as the broader structure remains constructive.
Understanding the Current Chainlink’s Wave Structure
On the 1-hour Chainlink chart, price movement shows a moderate upward trend, but it lacks strong momentum. The rise from the December 18 low does not appear to be a powerful breakout; instead, it looks like a corrective A–B–C pattern. The market is likely in the C-wave, with a possible final push toward around $15.8 if key support between $12.86 and $13.43 continues to hold. This upward move is expected to be weak and gradual, as the market sentiment suggests waning strength.
Overall, the market seems to be in a corrective phase known as Wave Four, which often moves sideways or unevenly. While one more short-term rise is possible, the price action remains choppy and cautious, showing no clear signs of a strong bullish breakout at this time.
LINK/USDT Analysis: The Bulls Are Defending $13.70: What’s Next?
On the 4h chart, LINK/USDT appears to be consolidating under the $14 price level, signaling balance in the market structure between the buyers and the sellers. Meanwhile, the Stochastic RSI seems to be suggesting moderate bullish momentum despite the lack of follow-through. To this end, if a dip buying can be spotted around $13.70, a close above $14.20 may be recorded.
You can purchase crypto coins here. Buy Crypto